How-to: Analyzing JVM garbage collection using Loggly
At Loggly, we love all kinds of logs – and JVM garbage collection logs are no exception. Most of our backend software runs on JVM, and the infrastructure team writes Java and Clojure code.
One of the biggest contributors to latency in a JVM environment is garbage collection(GC), so it is important to periodically monitor this activity. I have in the past used visualization tools like GCViewer, and our team uses VisualVM extensively. But all of the GC stats can be captured in a GC log, so why use another tool when you have Loggly?
Configuring JVM
To output GC logs with timestamps, add these in addition to your other JVM options:
-XX:+PrintGCDetails
-XX:+PrintGCDateStamps
-XX:+PrintGCTimeStamps
-Xloggc:$APP_LOG_DIR/$APP_NAME-gc.log
Once you have these options, you will have a GC file with logs like:
2013-10-25T18:35:43.387+0000: 441.482: [GC [PSYoungGen: 2430541K->268617K(2484544K)] 7687523K->5660738K(8076992K), 0.3266870 secs] [Times: user=1.05 sys=0.17, real=0.33 secs]
2013-10-25T18:35:43.714+0000: 441.809: [Full GC [PSYoungGen: 268617K->0K(2484544K)] [ParOldGen: 5392121K->354965K(5592448K)] 5660738K->354965K(8076992K) [PSPermGen: 44444K->44395K(83968K)], 0.9225290 secs] [Times: user=2.22 sys=0.26, real=0.92 secs]
Configuring rsyslog to send to Loggly
First, follow the directions here to configure rsyslog to forward logs to Loggly. The rsyslog server has the capability to watch a file and forward file changes to remote central logging facility such as Loggly. We use this configuration to ship GC logs to Loggly. Configuration details for tls rsyslog are documented here.
Make sure to restart the rsyslog service
$ sudo service rsyslog restart
Within no time, we will be ingesting and indexing your GC log events, so they’re ready to be analyzed. Because we extract all the important fields from GC logs without further configuration, you can use them with all of Loggly’s features.
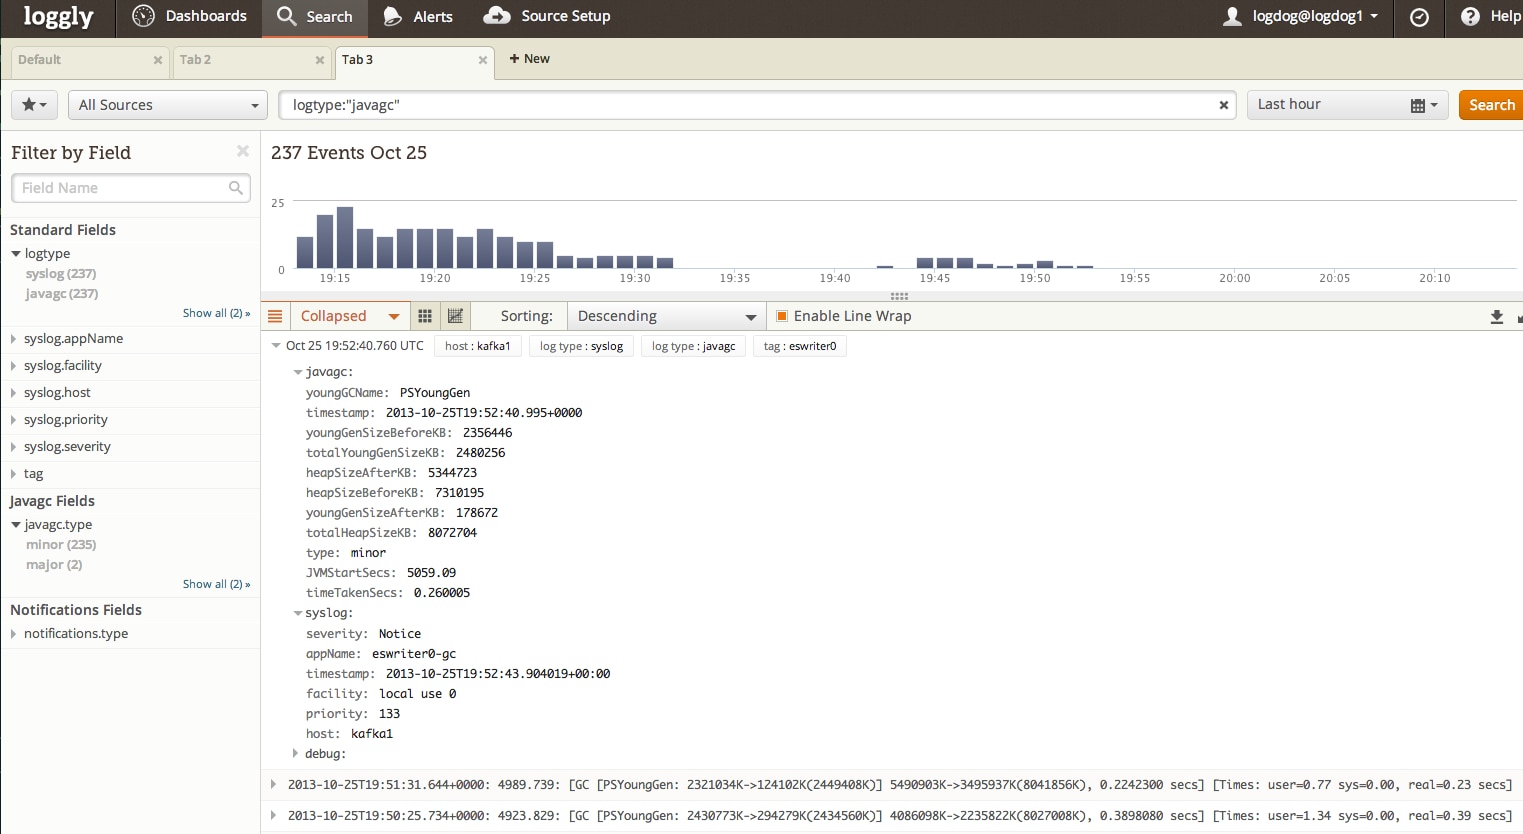
Searching for GC Logs
GC logs are automagically recognized and have a log type called “javagc”. For example, you can enter logtype:”javagc” in the search box to get all GC logs. Also, the fields extracted can be searched using javagc.<field_name> like javagc.type:”minor”. We support full Lucene query syntax, so knock yourself out with all those range queries on heap sizes.
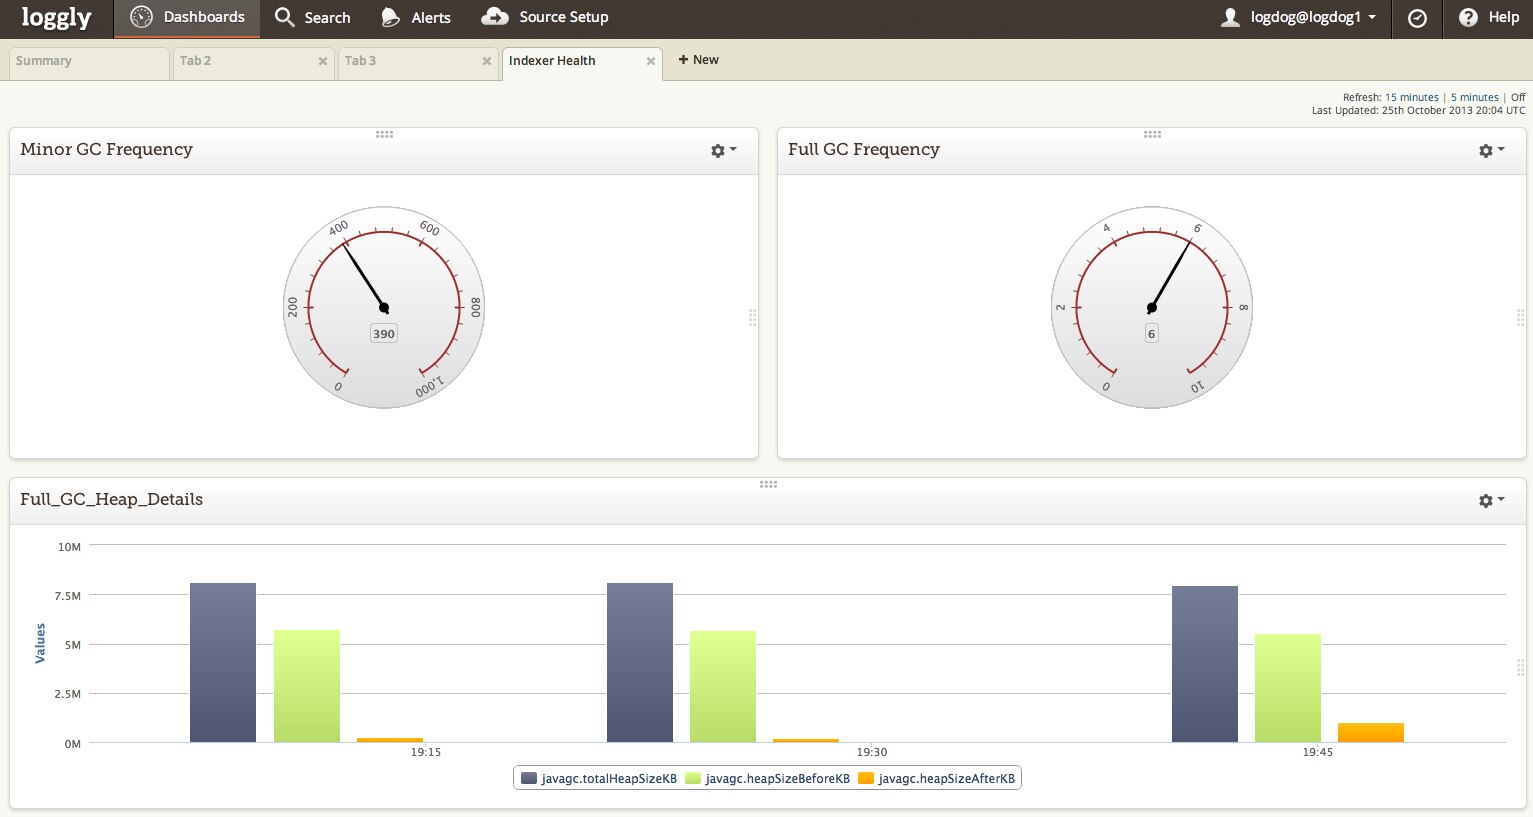
Using Trends to Visualize GC activity
At Loggly, we have a dashboard to visualize and monitor GC activity. We measure:
- Full vs Minor GC activity for the last 1 hour
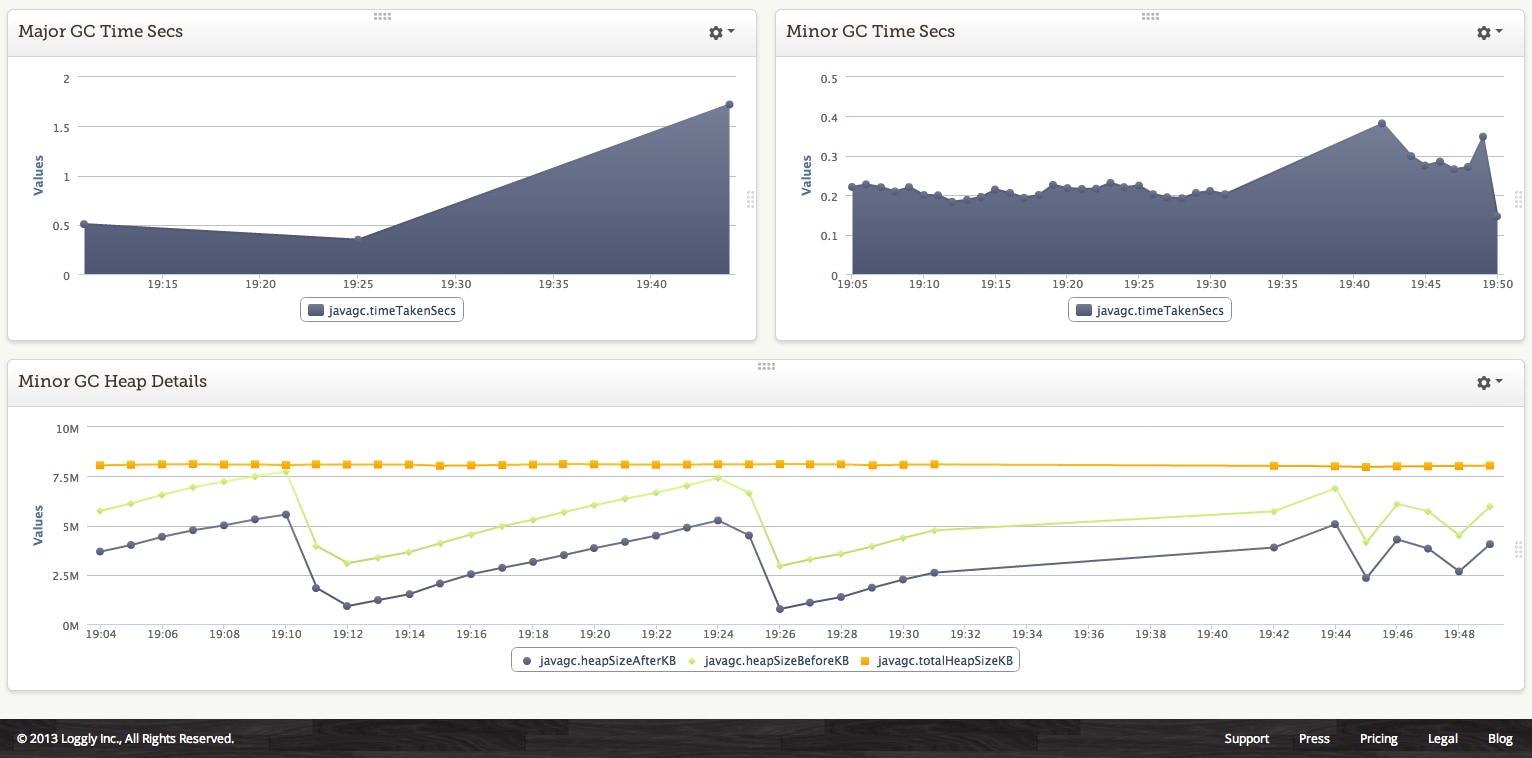
- Heap details before and after collection for a full GC using fields – javagc.heapSizeAfterKB, javagc.heapSizeBeforeKB, javagc.totalHeapSizeKB
- Full and Minor GC times
Here is a dashboard from one of our development machines:
Tags
The Loggly architecture is service oriented, and we have multiple JVM services running on EC2. We use tags to differentiate the GC logs originating from all these services. To configure tags for a deployment, you would need to insert a structured data (key, value pair) in the syslog header. For example I have created a tag called indexer so I can filter these logs in my analysis
# This is a filter to Loggly. Substitute your Customer Token for TOKEN
$template LogglyFormat,"<%pri%>%protocol-version% %timestamp:::date-rfc3339% %HOSTNAME% %app-name% %procid% %msgid% [TOKEN@41058 tag=\"indexer\"] %msg%\n"
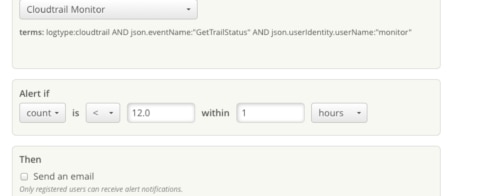
Alerts
Alerts is a really useful feature to notify you of a badly performing JVM application. For example, you can create an alert to trigger if full GC’s are occurring very frequently. We can also notify using PagerDuty.
With all these capabilities, Loggly is a great solution for monitoring and analyzing your JVM applications. With 3,500+ customers, we’ve seen almost every use case out there. So get started today and send us your GC logs and never miss visualizing another stop-the-world collection!
The Loggly and SolarWinds trademarks, service marks, and logos are the exclusive property of SolarWinds Worldwide, LLC or its affiliates. All other trademarks are the property of their respective owners.

Hoover J. Beaver