
Technical Resources
Educational Resources
APM Integrated Experience
Connect with Us
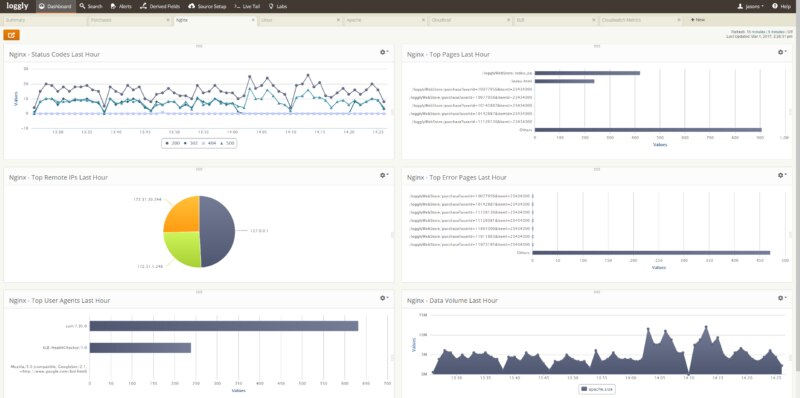
Turn any search or any graph from Loggly’s powerful analytics into a customizable dashboard.
Use Loggly’s pre-built dashboards or create your own. Easily share your dashboards with colleagues.
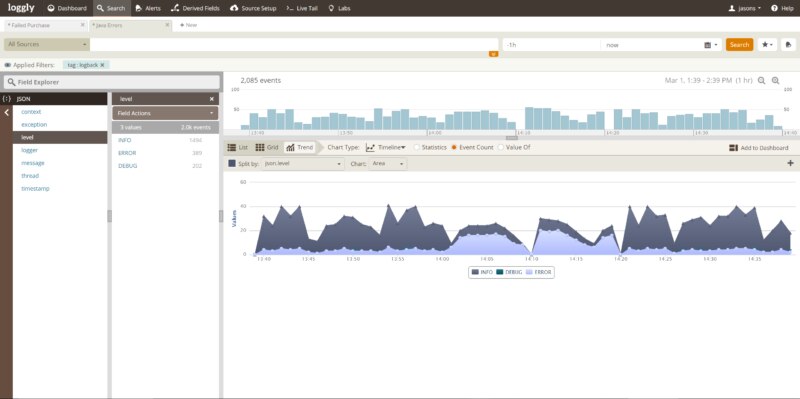
One-click access to line, bar, or pie charts based on counts, sums, or statistical measures.

Anyone with more than six or seven microservices in production on more than 20 servers simply must centralize the log data. Loggly is a no-brainer.
Mohit Khanna Senior Cloud Architect, Datami
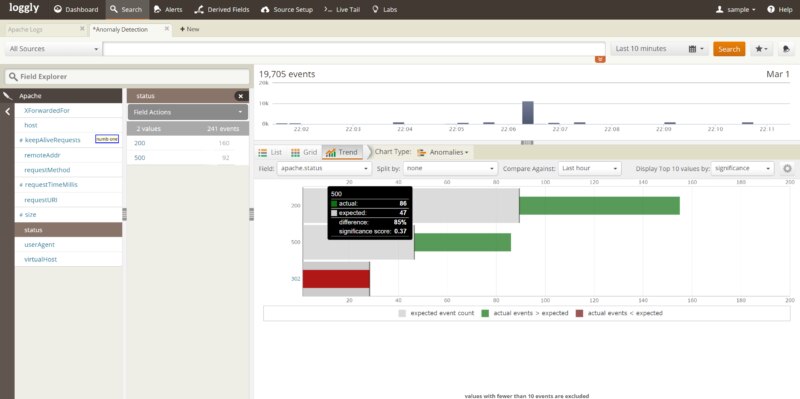
What if something unknown and unexpected shows up in your log data – something you would never search for and that triggers no alert?
Loggly learns the normal patterns in your log data and shows any deviations so that you can discover unexpected or suspicious events before they turn into problems.
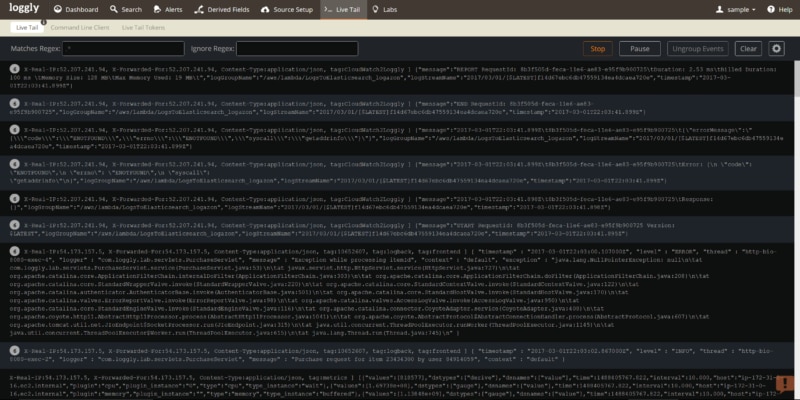
The classic tail command on steroids.
Think real-time tail -f across all your log files from all your distributed systems. Pattern-based filtering and color coding help you to focus on what matters to you. No need to have root access or to log into remote systems.
Use the web UI or stay classic with our command-line client that runs on Linux, Windows, and Mac. Or send a filtered log stream to HipChat or Slack in real time to let other colleagues weigh in.
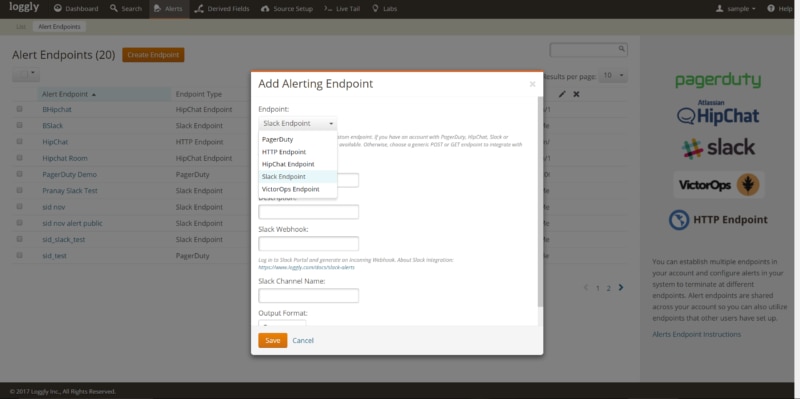
Create alerts based on search patterns, thresholds for specific log metrics, or other conditions.
Alerts include context such as sample events and a direct link to the events within Loggly.
Send alerts to HipChat, Slack, PagerDuty, VictorOps, or your own Webhook-compatible notification service.
Trace issues down to their root cause by analyzing them in the context of the entire stack.
Analyze and visualize your data to answer key questions, track SLA compliance, and identify anomalies.
Loggly integrates with Slack, HipChat, JIRA, PagerDuty, and other collaboration solutions.
Multi-tenant SaaS provides scalability, flexibility, and availability to meet the highest standards with low TCO.

See a five-minute Loggly tour.