
Technical Resources
Educational Resources
APM Integrated Experience
Connect with Us
Eliminate issues before they affect users or cause service interruptions with a continuous and proactive view of performance across applications, services and infrastructure down to the request level.
Quickly spot patterns across interconnected services, events, and issues with trace information in content of events and proactively tune performance to prevent issues.
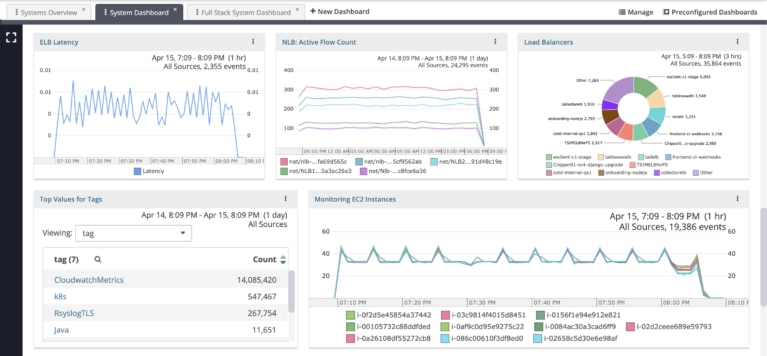
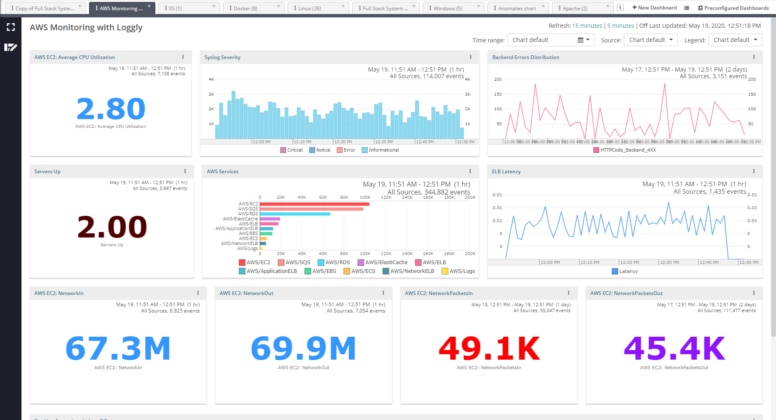
Easily build dashboards to monitor application health, behavior, and trends, or use one of our pre-built dashboards to monitor performance indicators (KPIs) and statistics. View related charts in one dashboard, regardless of the underlying data source.
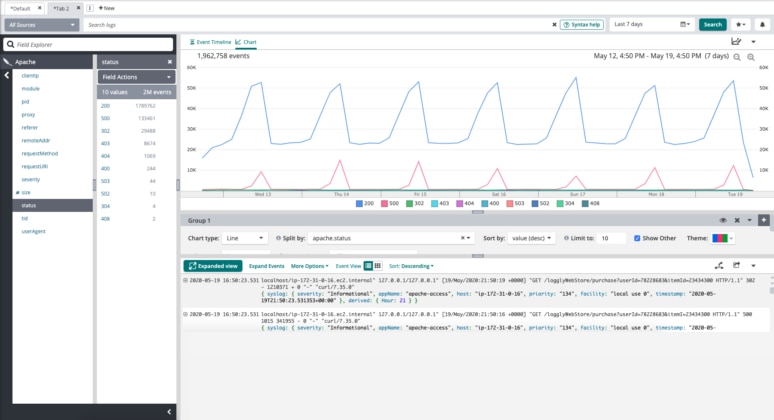
Use different chart types to visualize complex time-series data. Easily compare a dataset against itself from a day or week before using timeshift.
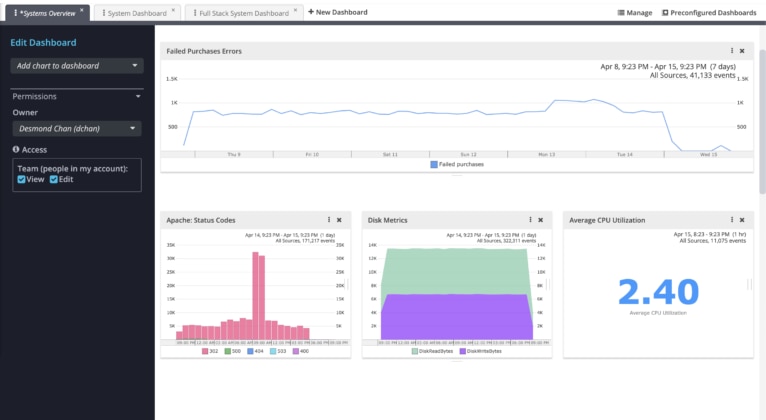
Share one or more dashboards with multiple team members to get everyone on the same page. Control who can manage and edit dashboards. Send dashboards to anyone via email or collaborations systems like Slack.

Anyone with more than six or seven microservices in production on more than 20 servers simply must centralize the log data. Loggly is a no-brainer.
Mohit Khanna Senior Cloud Architect, Datami
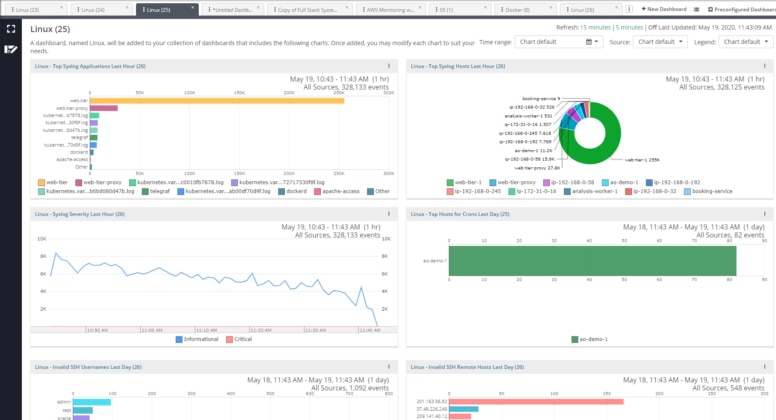
Optimize dashboards for display on large screens in your operations center. Easily resize and rearrange charts to suit your needs.
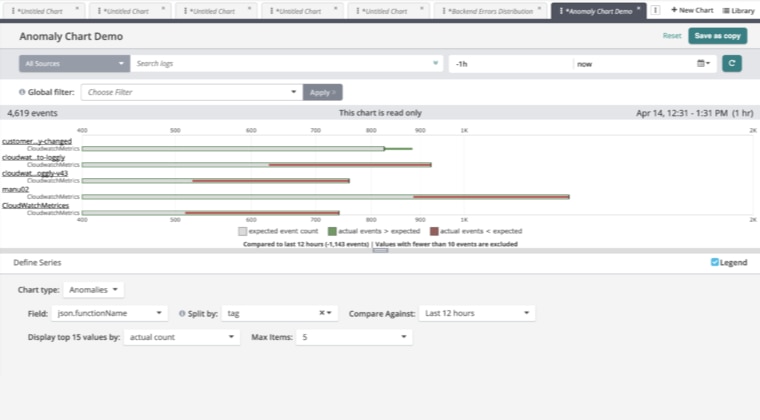
What if something unknown and unexpected shows up in your log data – something you would never search for and that triggers no alert?
SolarWinds Loggly® learns the normal patterns in your log data and shows any deviations so that you can discover unexpected or suspicious events before they turn into problems.
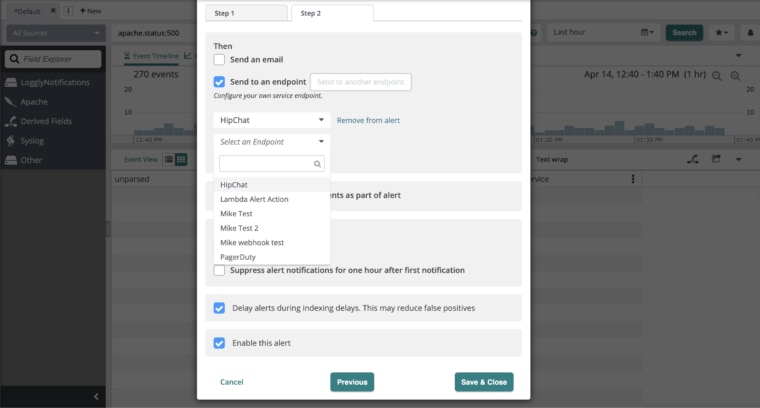
Create alerts based on search patterns, thresholds for specific log metrics, or other conditions.
Alerts include context such as sample events and a direct link to the events within Loggly.
Send alerts to Slack, PagerDuty, Teams, or your own Webhook-compatible notification service.
Trace issues down to their root cause. See how components interact across your stack, identify correlations, view source code, and share findings with your team.
Analyze and visualize your data to answer key questions, track SLA compliance, and spot trends. Loggly simplifies investigation and KPI reporting.
Work better as a team using data and analysis with DevOps tools. Loggly integrates with Slack, GitHub, Jira, PagerDuty, and more.
Our multi-tenant SaaS provides a secure, fast, scalable, and highly available solution to meet the highest standards while keeping TCO low.
See how to build dashboards with Loggly.