
Technical Resources
Educational Resources
APM Integrated Experience
Connect with Us
Experience near-instant response for searches over massive data volumes and long time periods. Analyze the entire range of your log data, in a highly interactive fashion.
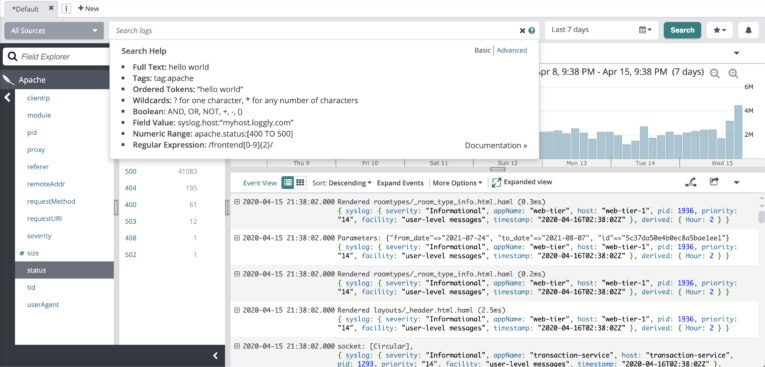
Perform full-text searches, searches by individual fields, ranges, and booleans without learning a proprietary query language.
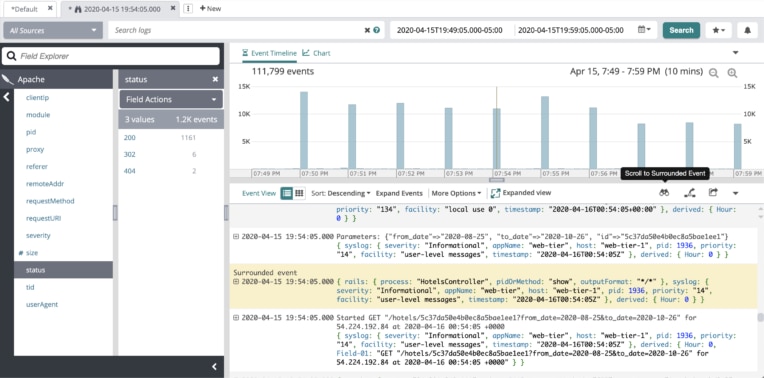
What happened just before or just after?
With a single click, view the surrounding events that occurred just before or after critical events across the entire distributed stack.
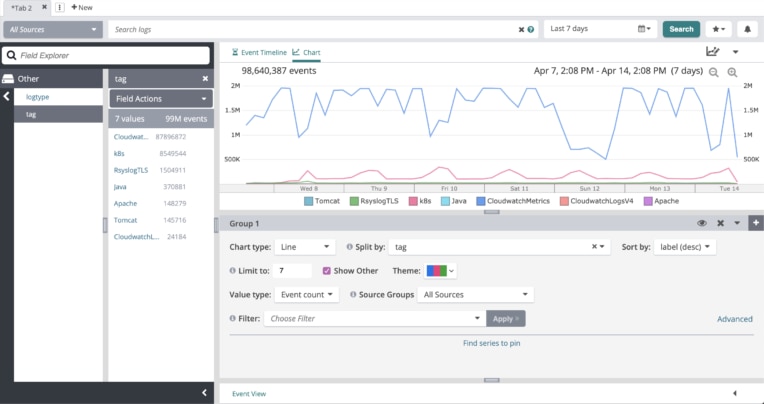
The hardest problems to fix are the ones that you least expect to happen. With Loggly Dynamic Field Explorer™, you’re never starting from a blank slate. It summarizes all of your log data as it’s received and lets you gain insight before setting up a single query. Spot unusual event counts or outliers and drill down into the relevant data with a few mouse clicks.

Better log management wasn’t something I initially thought of as a benefit of switching to Docker. But the combination of Docker and Loggly is very powerful.
John Kelvie Chief Technology Officer, XAPPmedia
Intelligent Agent
Spend less time setting up and start troubleshooting faster with an intelligent agent that automatically detects new systems as they come online, sends log data to SolarWinds® Loggly®, and collects metrics.
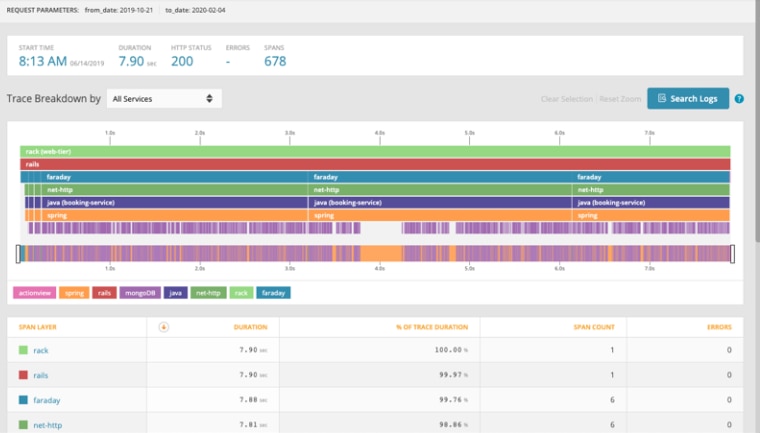
Common Trace ID
Stop hunting through systems to find relevant logs. The SolarWinds AppOptics™ integration with Loggly embeds a unique trace ID on all the logs associated with the services making up a transaction, and creates a common view of all the relevant logs associated with that transaction. The embedded trace ID allows you to view events in context and rapidly pinpoint bottlenecks and failure points.
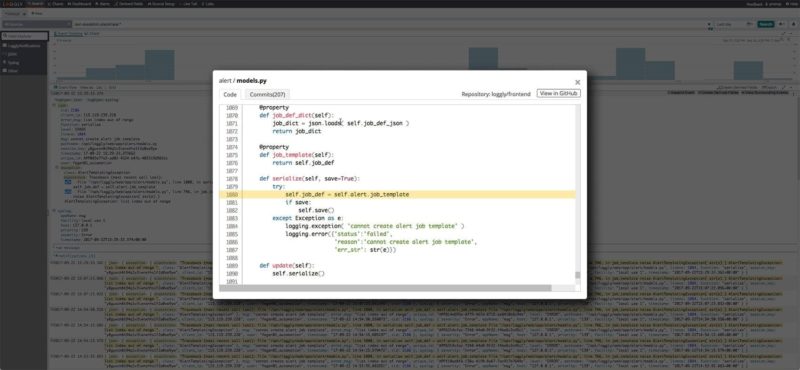
Within the Loggly interface, view the corresponding file and line in your source code from GitHub, based on filenames in stack traces. Support for Java, JavaScript, and Python application logs. See recent commits on those files and know which person on your team made recent changes.
Streamline the process of filing tickets in Atlassian Jira Software or GitHub from directly within Loggly with a single click, automatically adding relevant information from your log data analysis and pre-populated fields.
You no longer have to switch between tools and manually type or paste information. Stay focused, get the best out of both tools, and save time doing so.
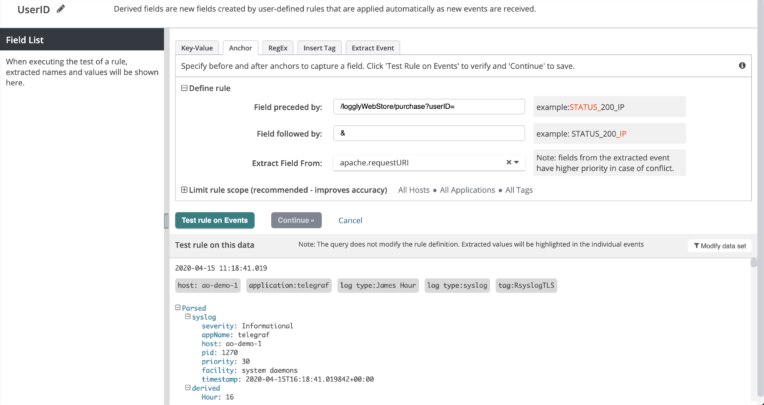
Need to refine Loggly’s built-in parsing rules or parse custom log formats?
Loggly not only makes it easy to define custom parsing rules through Loggly Derived Fields but also allows you to inject metadata tags based on your rules. This opens new and smart possibilities for processing your logs further.
Logs can also be divided into Source Groups, for example, to separate production, staging, and development environments within the same Loggly account.
View app performance, system behavior, and unusual activity across the stack. Monitor key resources and metrics and eliminate issues before they affect users.
Analyze and visualize your data to answer key questions, track SLA compliance, and spot trends. Loggly simplifies investigation and KPI reporting.
Work better as a team using data and analysis with DevOps tools. Loggly integrates with Slack, GitHub, Jira, PagerDuty, Microsoft Teams, custom webhooks, and more.
Our multi-tenant SaaS provides a secure, fast, scalable, and highly available solution to meet the highest standards while keeping TCO low.
Agent-free log collection makes setup simple and fast. If it logs, it can log to Loggly.