Technical Resources
Educational Resources
APM Integrated Experience
Connect with Us
As logs hold critical insights, it’s important to create a reliable and scalable setup for managing all kinds of application, database, and infrastructure logs. SolarWinds Loggly meets this requirement with its SaaS-based log management and analytics service.
You can send MySQL logs to Loggly over syslog using a simple script which configures your rsyslog daemon to track new events and transmit them continuously. With all your logs in one place, you can correlate different logs in real time, check trends, and make informed decisions to keep your IT environment running and performant.
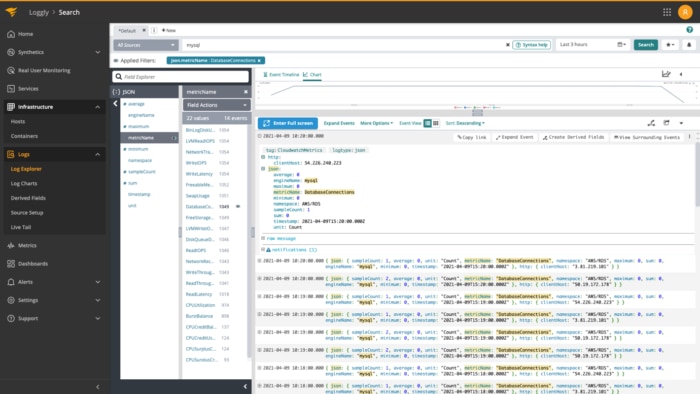
A MySQL database can perform slowly due to many factors, log monitoring can help you identify what and why there are performance issues. For instance, when you stream your database logs to Loggly, it automatically parses these logs into various fields and helps you quickly visualize pertinent log lines that show database errors, slow queries, changes in performance, etc.
As Loggly is built for speed and interactivity, you can get your search results quickly. The dynamic field explorer is another important feature, that can help you click and browse through various fields without using multiple search queries. With these features, Loggly significantly improves the time to detect and troubleshoot issues and enables proactive management.
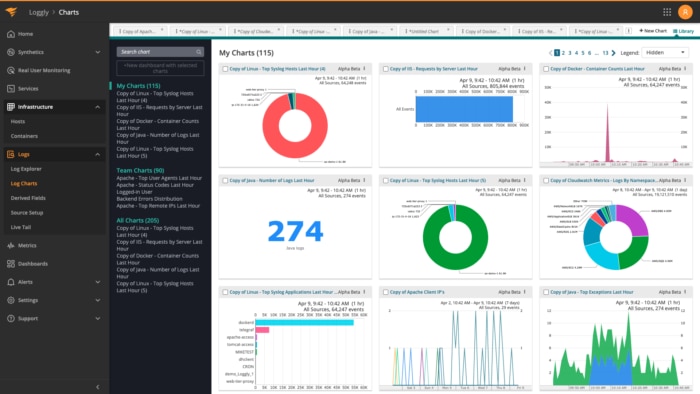
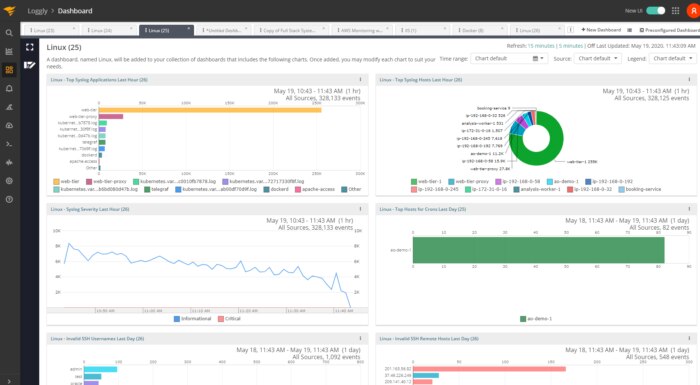
Loggly provides you with advanced charts and dashboards for a quick overview of your environment. It can simplify the monitoring of key performance metrics and usage statistics with your MySQL logs. For instance, a chart can help you identify performance patterns, like if a query is always running slow or if there are specific periods of time when this happens. With such information, you can drill down to specific logs and get to the root cause of issues faster.
Loggly also allows you to share your dashboard with your team for improved collaboration. You can set alerts for specific events and thresholds, and receive them over notification services like Slack, HipChat, and more. With these integrations, your team can work closely to resolve issues in time.
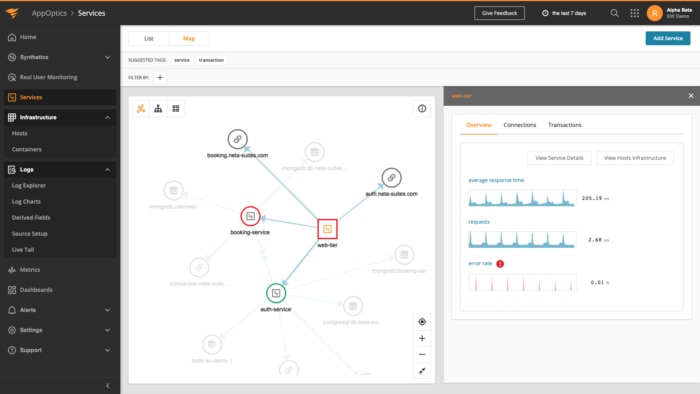
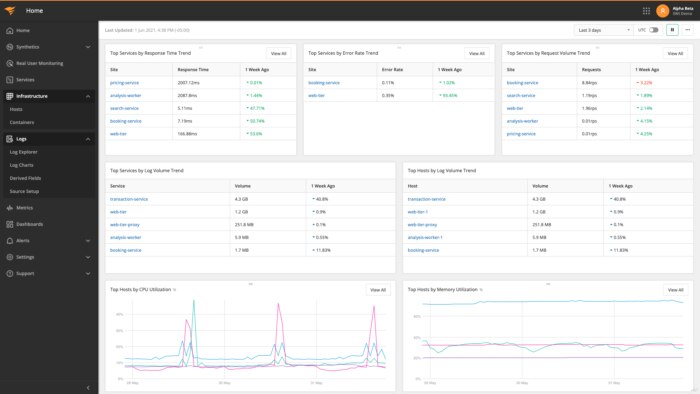
AppOptics is a comprehensive infrastructure and application monitoring tool that provides valuable insights into database and application health. The tool aggregates and centralizes the data in a database in an easy-to-access location for faster troubleshooting.
AppOptics consolidates business-critical metrics, pinpoints performance issues, and sends instant alerts to remain abreast of database anomalies. It also offers robust analytics and trend reporting to provide users with a clear view of spikes, dips, database performance changes, and resource utilization.
While Loggly offers centralized monitoring of MySQL logs, filtering, and sharing of specific logs to troubleshoot issues proactively, AppOptics provides accurate performance metrics to view all critical data points at once.
Together, these tools provide business-critical information that can be leveraged to speed up the troubleshooting process, and help you pinpoint what’s causing performance problems and why. Both the tools also offer proactive alerting features to get real-time notifications about performance issues or errors.