Technical Resources
Educational Resources
APM Integrated Experience
Connect with Us
Due to the absence of a native solution, teams have to rely on third-party applications for Docker Swarm monitoring. Most of these solutions pose complex configuration challenges.
Most traditional tools offer little help in keeping track of applications in distributed and stateless container environments. Teams have to spend endless hours with these logs to troubleshoot issues.
There is no straightforward way to visualize search results. Teams often use open-source solutions for this purpose, but these solutions require complex configuration.

As containers are stateless, logs have to be archived before the container shuts down, which means teams have to collect all logs persistently. However, in distributed environments running multiple microservices across different nodes, log volumes can increase rapidly.
Traditional logging setups are not equipped to handle such volumes. SolarWinds® Loggly® solves all these Docker Swarm logging challenges by providing cloud-based log management and analytics. The Loggly agentless architecture makes log aggregation from all kinds of sources extremely simple. You can send your Docker Swarm logs to Loggly with Logspout.

As discussed, the multi-tier structure in container environments makes logging difficult. By centralizing all your logs in one place, you can significantly reduce the amount of time and effort needed to troubleshoot problems. Loggly can automatically parse and index messages so you can search, filter, and chart logs in real time.
The Loggly Dynamic Field Explorer offers a highly intuitive approach to analyzing logs. In this explorer, you can click and browse through your logs without any need to type multiple commands in the console.

It is not easy to analyze text logs manually. Organizations need automated tools that visualize log search results to identify hidden patterns and get a quick overview of their environment. That’s why Loggly helps you visualize the results of your search query.
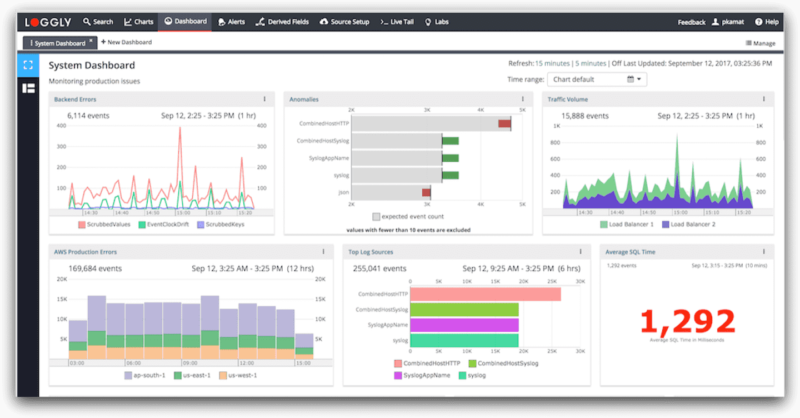
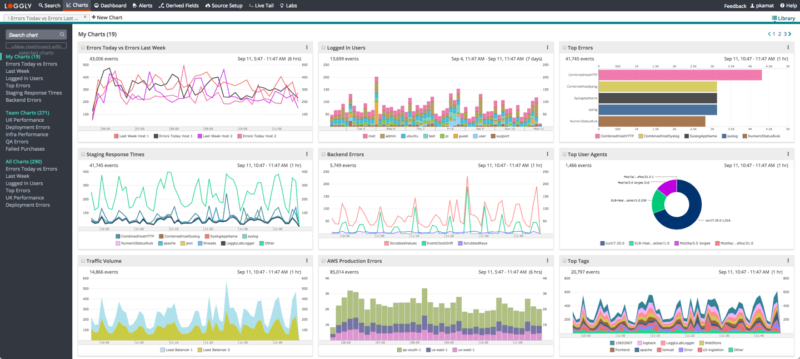
You can choose from different types of bar or line charts to analyze your logs. The Loggly anomalies trend chart allows you to find any major change in the event frequency. You can also aggregate these charts to create a unified dashboard and share it with your team. Team members can view or edit these charts depending on their access rights,and can also download a dashboard in the form of a PNG image.