Technical Resources
Educational Resources
APM Integrated Experience
Connect with Us
Large enterprises with modern IT environment have their data distributed across multiple systems, applications, and servers. Traditional log file analysis tools struggle to unify siloed data for effective analysis.
Most free log file analysis tools may get very slow while sifting through large log volumes. Lack of useful insights can make it difficult to quickly determine and resolve potential issues.
Teams have to integrate multiple web log analysis tools to visualize massive text logs for proactive analysis. But these open-source tools require complex configurations that increase overheads and hamper productivity.

SolarWinds® Loggly® is a cloud-based log analytics and management solution that allows you to centrally aggregate logs from different systems, servers, applications, and frameworks for end-to-end analysis. With Loggly, you can get a unified view of your distributed stack and can manage, monitor, and analyze your logs from a single platform.
Loggly is easy to set up and simple to use. It supports agentless architecture; there’s no need to install agents on servers for sending logs to Loggly. You can easily manage your older logs with Loggly, as it supports automatic archiving for logs on AWS S3 bucket to help you meet your log retention policies and compliance requirements.

Loggly offers powerful and interactive features to simplify log search and expedite analysis. It allows you to get quick answers to your search queries by swiftly scanning even the large log volumes. Unlike traditional log analysis tools, Loggly automatically parses various types of structured and unstructured logs into numerous fields to facilitate advanced analysis using different value fields.
The Loggly dynamic field explorer gives you an intuitive overview of your parsed logs without running multiple queries. You can simply browse through your log files to get to the root cause of an issue.

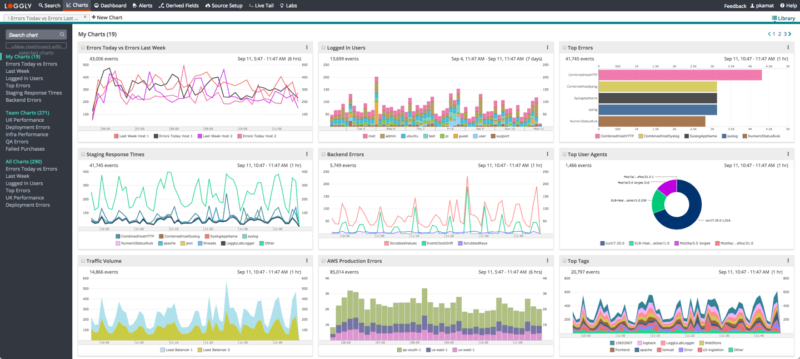
Most enterprises use free web log analysis tools to visualize their log data. However, they face numerous integration challenges while configuring these tools across the distributed stack. But Loggly overcomes these challenges by offering well-integrated charts and dashboards to streamline visual analytics. You can choose different types of charts to visualize your log data for analyzing key metrics, detecting hidden patterns, or spotting anomalies.
Loggly also allows you to choose from various ready-to-use preconfigured dashboards for Java, PHP, Windows, Python, Apache, and many more. The Loggly timeshift feature helps you compare charts, over a period of time, with a single click. It also allows you to download the dashboards in the form of a PNG image for reporting and collaborating purposes.