Technical Resources
Educational Resources
APM Integrated Experience
Connect with Us
Log viewers and log parsers help tech pros maintain the health of their applications without having to manually sift through log data.
Every day, your network devices and applications are generating hundreds of thousands (or millions) of lines of event log data. Though most of this information doesn’t require your attention, important log data is not only relevant but potentially critical to the current and future health and functioning of your applications. As a tech pro, you rely on log data to help you quickly understand why an application isn’t working so you can better develop an appropriate course of action.
Though log analysis is an integral part of maintaining applications, it can be time-consuming. To help streamline this process and alleviate the burden of sifting through thousands of lines of data, it’s now common practice to utilize a system log viewer or log parser. Here’s why these tools are a must for any tech pro.
All the activity and event data emitted by your network devices and applications, like warnings and error notifications, is stored within data logs. Unfortunately, these data logs are typically nothing more than unstructured, disorganized digital scrolls, which can make identifying the critical information you need for application troubleshooting overwhelming. This is where log event viewers and log parsing come into play.
A log file viewer allows tech pros to not only view but parse log data in ways more manageable and relevant to their needs by using a set of commands and queries. For example, if a tech pro wants to view only the slowest URLs on their site, they can use commands to do so. This allows them to more quickly pinpoint slow URLs and better understand what’s causing delays.
The commands you use within a log parser vary depending on the type of data and file format you’re searching for (IP address, URL, etc.). If you’re looking for hits per hour generated by a specific IP address, for example, you might enter something like:
logparser: select cs-uri-stem, count(cs-uri-stem) as requestcount from [LogFileName] where c-ip = ‘000.00.00.000’ group by cs-uri-stem order by count(cs-uri-stem) desc.
If you enter the right query in the right format, a log parser viewer should give you an inside look at only the most relevant data. With the right tool, tech pros can quickly search for a wide range of specific information within an otherwise undifferentiated roll of log data. In some cases, they may be able to organize information in a way all but impossible without this kind of tool.

A comprehensive log viewer or log parser will boast many features designed to make sorting and analyzing data more efficient, giving you hours back in your day and helping you keep abreast of device and application health, no matter how large your scope. Qualities to look for when evaluating a log viewer include the following:
1. Automation: With automation, your data is parsed as soon as it’s received, so you can map the structure of your logs in real time. When you need to perform a query, many tools offer automatically parsed formats to alleviate any command guesswork and streamline processes even further. If your log format isn’t among the automatically parsed formats, a comprehensive log file parser should still allow you to perform full-text searches.
2. Scalability: Traditional log file viewers require manual log file parsing. In today’s digital age, where logs are produced in abundance and at high volumes, traditional tools—including many free ones—are often too limited. Find a robust tool designed to support a wide and varied pool of logs. With this type of tool, you don’t have to worry about an unexpected spike in log volume triggering a loss of data.
3. Aggregation: Bringing all your logs together into one central location makes it easier to stay abreast of all log warnings, error messages, and other pertinent information. It also empowers you to search across the entire stack to identify the source of an issue and better plan your next troubleshooting steps.
4. Visual aids: Even when parsed, lines of data can be hard to analyze and make identifying patterns especially difficult. Look for a log viewer capable of parsing information and offering charts and dashboards so you can quickly see spikes in event occurrences or repeated activity.
5. Customization: The information you need to gather and analyze from your application event log is unique, and the way you use your application log monitoring tool should be too. A robust log file parser will allow you to create custom parsing rules, select which application event log data is most pertinent, and leverage color coding to focus only on areas of interest.
An effective log parsing tool should allow you to aggregate data and apply search queries and unique commands. Additionally, it should provide deep insights into performance throughout your IT infrastructure. With the right tool, you can troubleshoot issues and discover actionable insights faster than ever before.
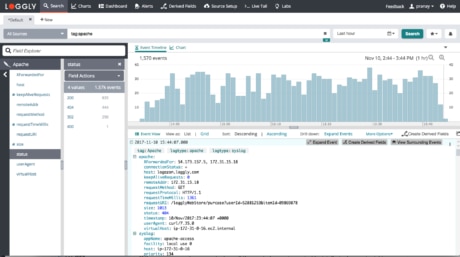
SolarWinds® Loggly® is an interactive, user-friendly log management solution designed to empower IT teams to dig deeper into their logs. This log file viewer and parser automatically parses your logs as they’re received, extracts useful information, and presents it in a structured format via its Dynamic Field Explorer. With this viewer, you can view parsed information and even click certain fields and values to further refine and filter log data.
Loggly also empowers you to generate summaries for various log information, such as all log data over a certain time or data from a set of hosts or users. Whatever you’re looking for, Loggly can likely help you find it quickly and efficiently. Visit our product page today and find out if Loggly is the right tool for your needs.