Technical Resources
Educational Resources
APM Integrated Experience
Connect with Us

When a Lambda function executes, whatever’s written to stdout is sent to CloudWatch Logs asynchronously. However, analyzing logs with CloudWatch alone can be challenging, as it offers limited features.
It isn’t easy for teams to parse, filter, and search AWS Lambda logs. Due to a lack of advanced tools, teams can struggle to get to the root cause of issues, and this can lead to an increase in mean time to resolution (MTTR).
Monitoring an endless stream of text-based logs on a console isn’t easy and can lead to manual oversights. Teams lack advanced visualization tools capable of helping them spot deviations and trends over a period.

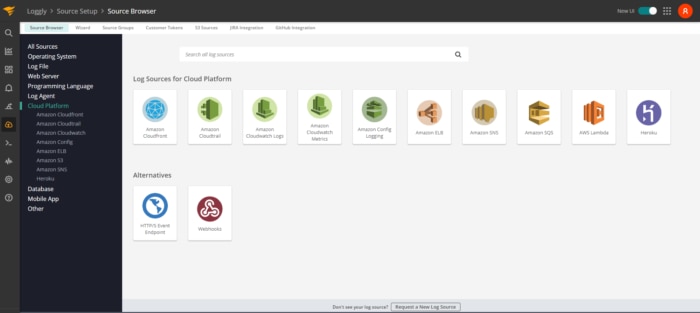
SolarWinds® Loggly® offers cloud-based log aggregation and analytics to help you monitor and analyze AWS Lambda logs. You can define AWS Lambda functions to automatically forward your logs to Loggly. There’s also a blueprint, which can help you ship your CloudWatch logs to Loggly. As a cloud-based service, Loggly simplifies initial setup and helps you get started within minutes. In addition to AWS logs, Loggly accepts all kinds of text-based logs for reliable management and analysis. With all your logs in one place, you can correlate events and resolve issues effortlessly. Furthermore, when logs get past the retention period, they can automatically be archived to Amazon S3 buckets.

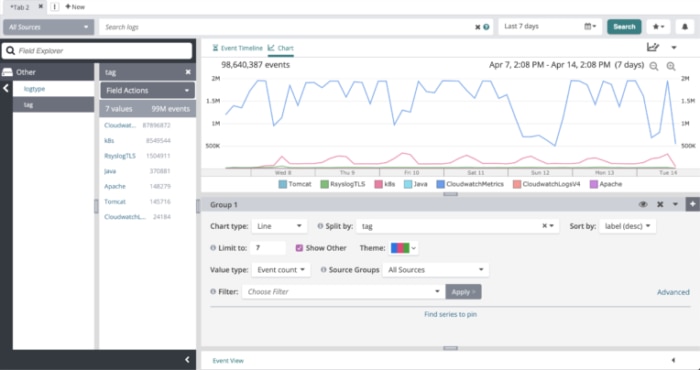
Loggly offers several advanced features for faster log analysis. It can search through a large volume of logs across your distributed stack and find quick results for your search queries. Loggly can automatically parse your logs into various fields and allows you to define custom parsing rules. You can find a structured summary of your logs in the Dynamic Field Explorer™, which allows you to click and browse information of interest under various fields without typing multiple queries. Additionally, to monitor the trail of events either before or after a critical event, you can use the surround search feature.

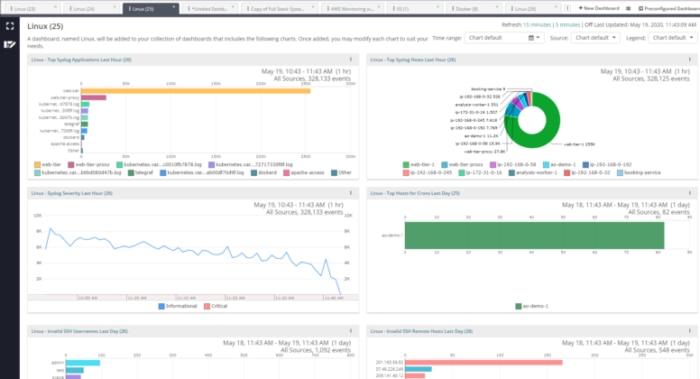
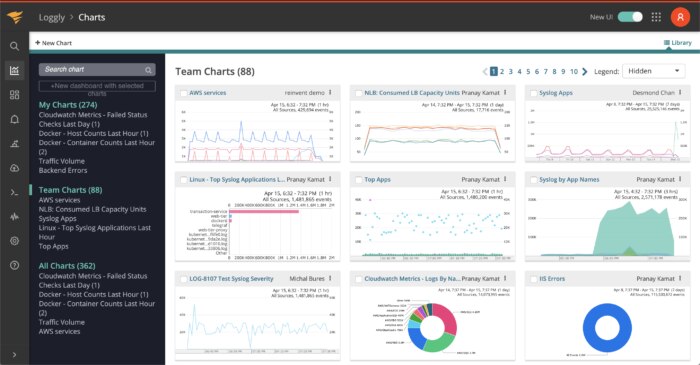
Loggly offers several types of line and bar charts to help you visualize your search results. You can club these charts to form a dashboard for monitoring your environment. The visualization helps you spot deviations or find significant patterns over a period. Furthermore, you can share your dashboard with your team members to keep everyone on the same page. Loggly also offers several preconfigured dashboards you can set up in a single click. Additionally, it offers integrations with tools like Slack, Microsoft Teams, JIRA, and GitHub, which can help your team collaborate efficiently to keep your systems shipshape.