Technical Resources
Educational Resources
APM Integrated Experience
Connect with Us
Sometimes Android updates can fail and lead to spikes in log volumes. Most Android app log viewers aren’t equipped to handle such increased workloads.
Traditional Android system log viewers can get extremely slow when the log volumes increase. This can severely impact application uptime and availability as the time to resolve issues increases.
There’s no easy way to visualize text logs, and teams have to configure multiple open-source tools for the purpose. Shuffling between multiple tools can hamper efficiency.

SolarWinds® Loggly® helps you aggregate all your Android logs on the cloud for centralized monitoring and analysis. This helps you easily extract useful insights from the logs including diagnostic data on the HTTP requests, request and response times, error stack traces, and more.
You can also monitor applications and infrastructure logs together to get to the root cause of the problem quickly. Moreover, unlike other Android log viewers, Loggly doesn’t take hours to install and configure as it has an agentless architecture. You can collect your Android logs using the timber-loggly package. This package uses the HTTP/S Event API to send your Android app logs directly to Loggly.

Loggly helps you monitor your Android logs with increased efficiency and provides near-instant results to all your search queries. You can analyze client and server errors along with the device name and get to the root cause of the issues quickly.
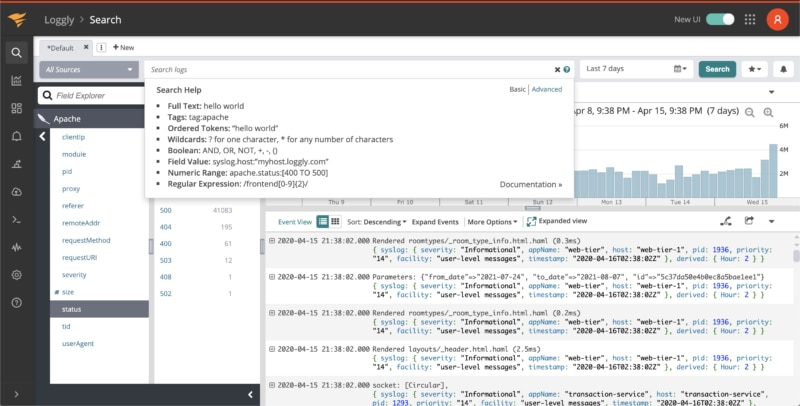
Unlike other Android app log viewers, Loggly offers higher interactivity and shorter workflows for most of the routine tasks in log monitoring and troubleshooting. Its dynamic field explorer provides a simple approach to extracting useful information from logs without engaging you in any trial-and-error searches.

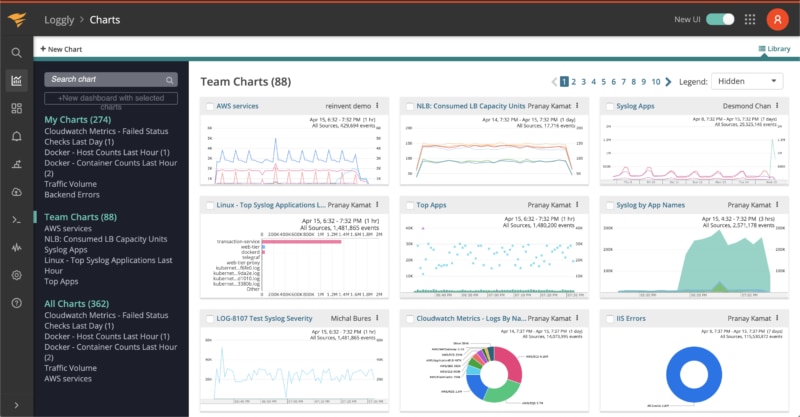
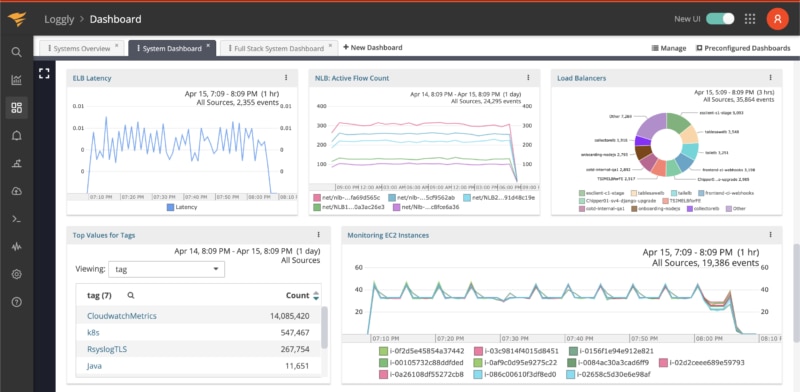
Loggly helps you visualize your search results with different types of line and bar charts. These charts help you spot recurring patterns and outliers easily. You can group multiple charts and drag and resize them to form a dashboard to get a big-picture view of your environment.
Unlike other open-source visualization tools, Loggly offers higher interactivity and speed. You can sync all your charts to a common time with a single click. Similarly, the Timeshift function allows you to compare charts over a period of time. Loggly also allows you to share your dashboards with team members with different permissions. Alternatively, you can download the dashboard in a PNG format and share it via Slack or email.