Technical Resources
Educational Resources
APM Integrated Experience
Connect with Us
Application performance issues often occur due to server slowdowns, lack of load balancing, bandwidth, and application code issues. Integrated application performance monitoring (APM) ensures applications run smoothly and provide significant value to a business. To deliver an integrated APM experience, collect metrics, logs, and traces together to identify and troubleshoot application and infrastructure issues faster. View all the data in a single interface to ensure complete observability.
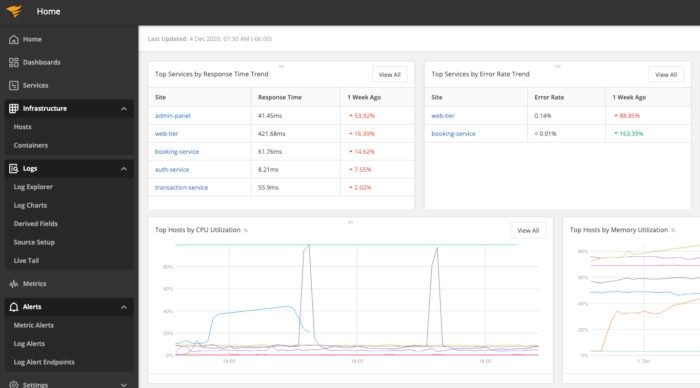
AppOptics provides visibility into cloud and on-premises custom applications and infrastructure, including servers, virtual machines, and containers, with over 150+ integrations. It performs live code profiling, distributed tracing, and exception tracking to accelerate root-cause analysis, so you can quickly fix the issue causing the application to be non-performant.
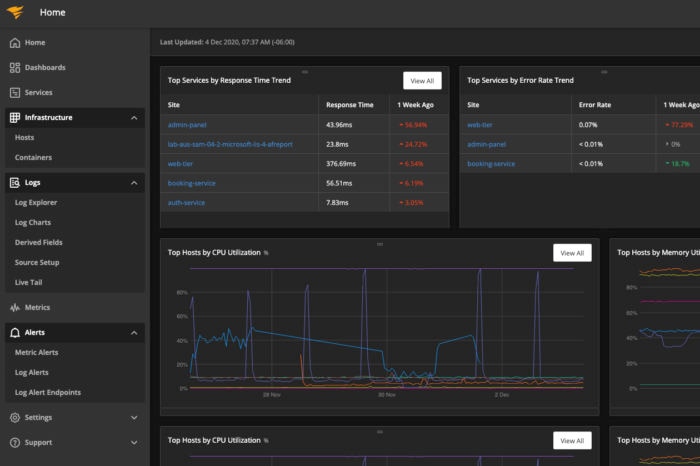
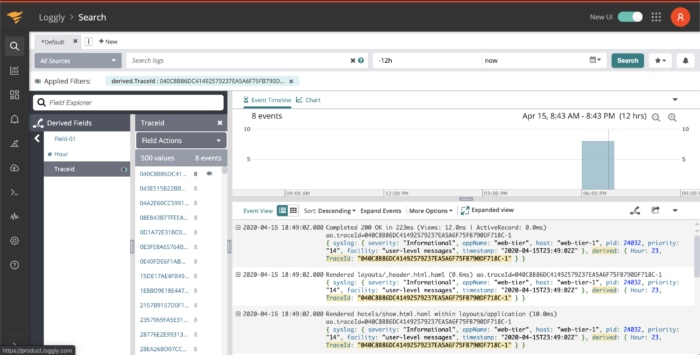
AppOptics provides valuable insights into physical and virtual hosts and applications. It helps monitor and analyze business-critical applications all the way down to the poor-performing code. Loggly also allows you to drill-down into the logs in context of a transaction request to find the root cause of IT resource performance issues.
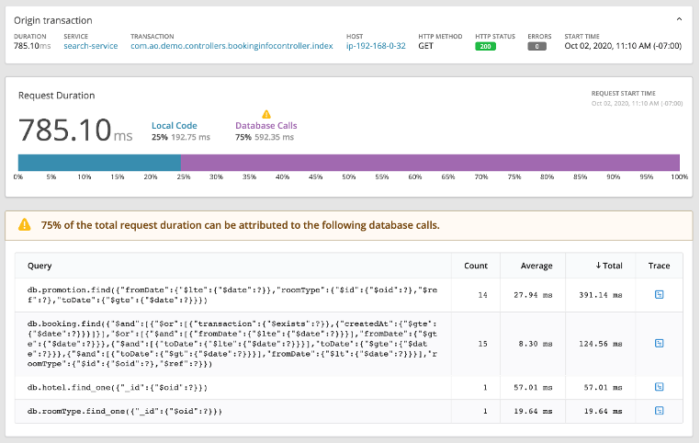
Together, AppOptics and Loggly can be used as a powerful server-side monitoring suite. Loggly provides an incredible amount of data and a high-level of statistics, including HTTP errors, while AppOptics collects metrics and traces that give useful information about the health of critical systems. Data collected through metrics, traces, and logs provide in-depth information about resources and apps. Bringing all the information together enhances observability across the stack.
Ops managers, SREs, application owners, and developers use the combined capabilities of AppOptics (metrics and traces) and Loggly (log events) to enhance the performance of the entire IT infrastructure. Together, these tools help you understand what the issue is and why it occurred, reducing mean time to resolution (MTTR), improving end-user experience, and providing uninterrupted services. Additionally, SolarWinds provides a common Snap Agent to ease the collection of logs, metrics, and traces through auto-detection and log filtering features.