Technical Resources
Educational Resources
APM Integrated Experience
Connect with Us

Engineers have to track several service-specific metrics and analyze logs from different web servers, applications, and OS. Configuring a logging setup for such a diverse environment is challenging.
Monitoring AWS resources with traditional logging tools can be challenging. Teams have to find workarounds, integrating multiple tools for unified monitoring of their cloud and on-premises environment.
It is not easy to respond to several alerts, analyze text log data, separate recurring patterns from random flukes, and troubleshoot issues in a short time without dedicated tools for visualization and log analytics.

If you operate in multiple locations, monitoring metrics from different AWS regions is not simple, even with CloudWatch or any other AWS logging service.
SolarWinds® Loggly® can help you solve your logging challenges with its log aggregation and monitoring capabilities. It helps you collect logs and metrics from CloudWatch and CloudTrail for unified monitoring of your infrastructure and applications. Its agentless architecture ensures you can send CloudWatch logs and metrics to Loggly without any elaborate setup. Loggly accepts logs from ALB, ELB, CloudFront along with any other uncompressed line-separated text file from AWS. As logs get past the retention period, they are automatically archived to AWS S3 buckets.

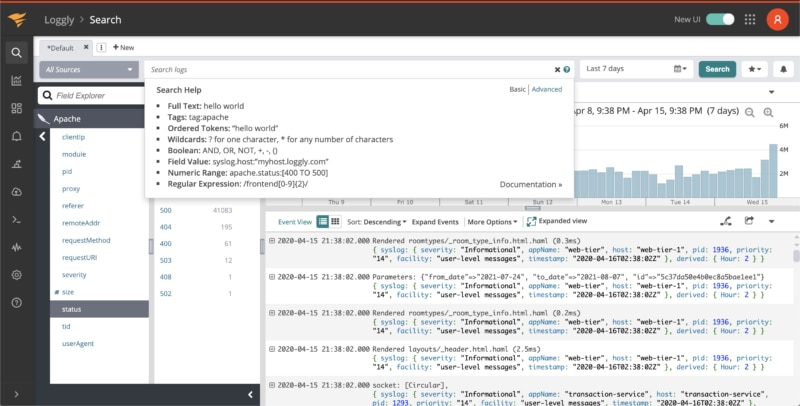
In addition to AWS centralized logging, Loggly offers advanced features for searching, indexing, and, filtering, which improves your log analytics. Its interactive search allows you to sift through large data sets, quickly. With automated log parsing, it helps you get near-instant results for your searches.
The Loggly dynamic field explorer feature significantly improves the search and troubleshooting experience with a highly intuitive interface. You can click and extract the most relevant information from your logs without any need to resort to the CLI.

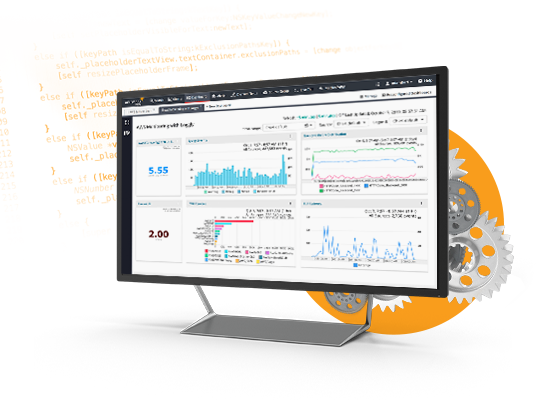
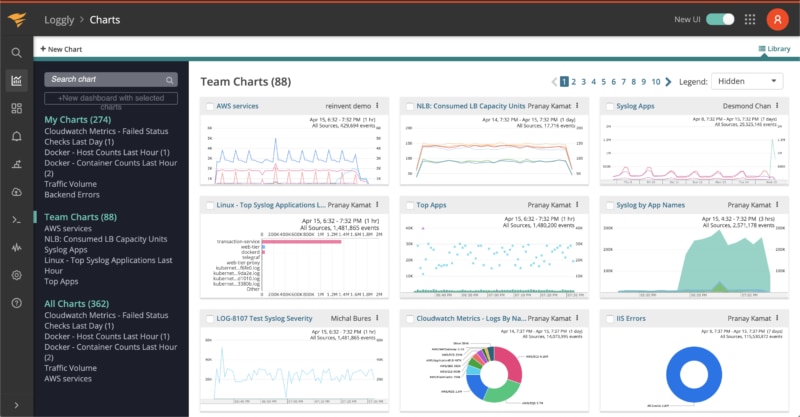
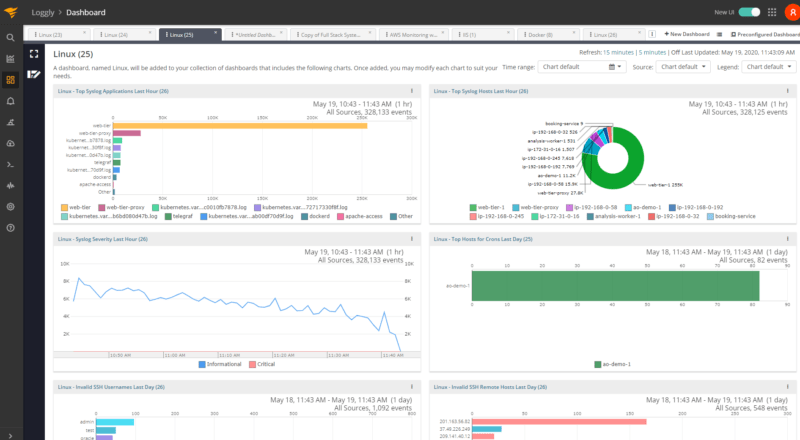
Loggly offers pre-configured dashboards for tracking several AWS metrics. You can configure these dashboards to include your custom metrics and performance indicators. Offering better interactivity, Loggly allows you to drag and resize the charts in these dashboards and project them over a larger screen in your operations center.
With a visual overview of your environment, you can easily spot any deviations from the normal and drill down to resolve issues. You can also download a dashboard in the form of a PNG image and share it over email or Slack with your team members. Loggly’s integration with GitHub, JIRA, PagerDuty and other common notification services adds significant agility to your operations.