Technical Resources
Educational Resources
APM Integrated Experience
Connect with Us
Django takes a lot of hassle out of web application development, but logging Django can be tricky. Without a streamlined process to manage Django logs, which can multiply at a fast pace, there’s a risk of losing critical log data. Loggly helps create a cloud-based centralized logging setup to receive all your logs and make them available through an easily accessible web interface.
As Django uses Python’s built-in logging module for system logging, you can easily collect these logs using syslog as soon as your Django logs are generated and sent to a local rsyslog daemon. Additionally, you can also use the Python handler class. Loggly indexes your logs in near-real time and presents you with a single interface for searching, analyzing, and visualizing the data.
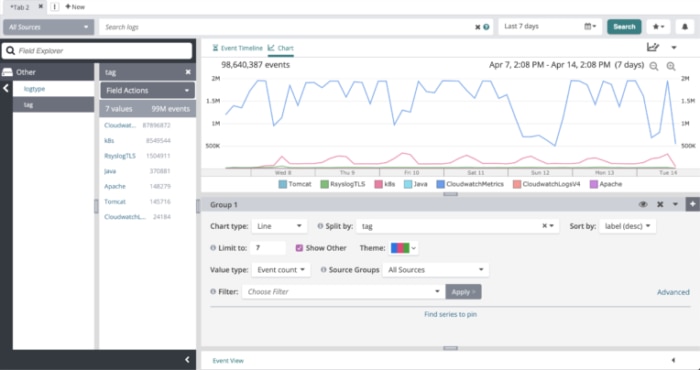
The search function in Loggly is based on Lucene and provides many powerful options to cut through the noise in Django logs and find exactly what you’re looking for. You can use filters to display the events matching a unique value, range queries to find events exceeding thresholds, regular expressions to identify events corresponding to patterns you’re looking for, and even advanced Boolean queries. In addition to powerful search and filter options, Loggly provides a Dynamic Field Explorer™, which allows you to view the structure and frequency of the automatically parsed events.
You can save important searches and create automated alerts using services like Slack, and you can even integrate alerts into Opsgenie or PagerDuty to receive text alerts. Since Loggly was designed to search and analyze large volumes of log data, even if a developer leaves the log level set at debug, you don’t need to worry about your log management being overwhelmed with events.
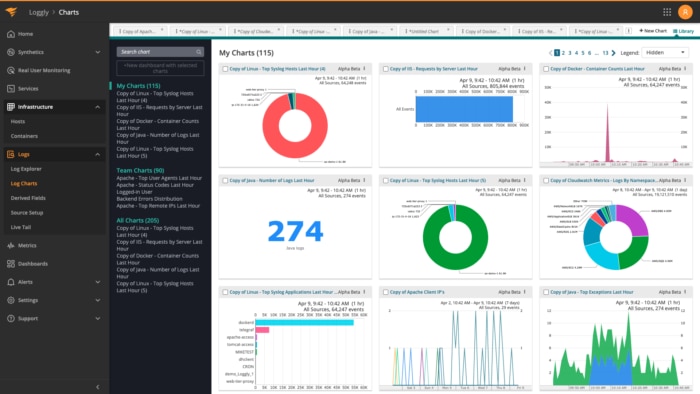
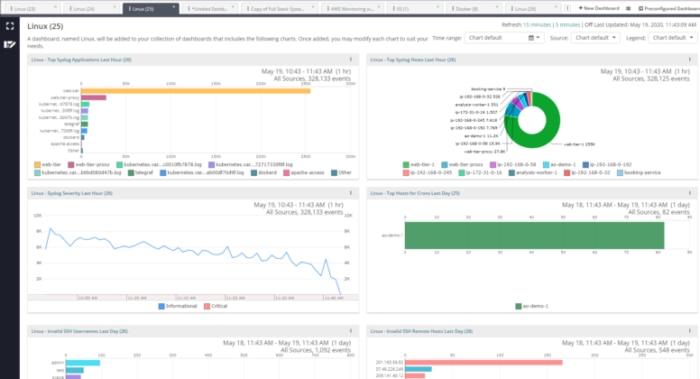
Loggly simplifies log analysis with advanced data visualization. It helps you create interactive and shareable dashboards to visualize data, with charts capable of plotting time series and non-time series data for your Django logs. You can use any kind of structured or unstructured log data to create charts. These charts can be sorted on both values and labels and can capture averages, percentiles, log event counts, and more.
Another advantage of Loggly is it allows you to sync all your charts in the dashboard to the same time range with a single click. This allows you to correlate all log data around an event for quicker troubleshooting.
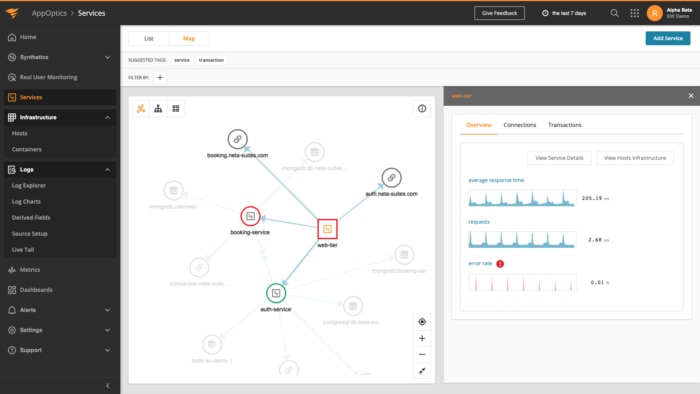
While Loggly helps aggregate, manage, and analyze Django logs generated from multiple sources, AppOptics offers infrastructure, application performance, and availability monitoring. AppOptics seamlessly integrates with Loggly to provide end-to-end visibility into Django application performance. The APM metrics includes key performance indicators such as error rate, response time latency, request volume, and resource consumption metrics.
AppOptics helps track Django application requests and pinpoint performance issues with advanced functionalities such as distributed tracing and live code profiling. It also sends instant notifications in case of errors, performance issues, transaction failures, and large changes in traffic patterns. Together, AppOptics and Loggly provide a unified view of Django metrics, traces, and logs, offering an integrated APM experience.
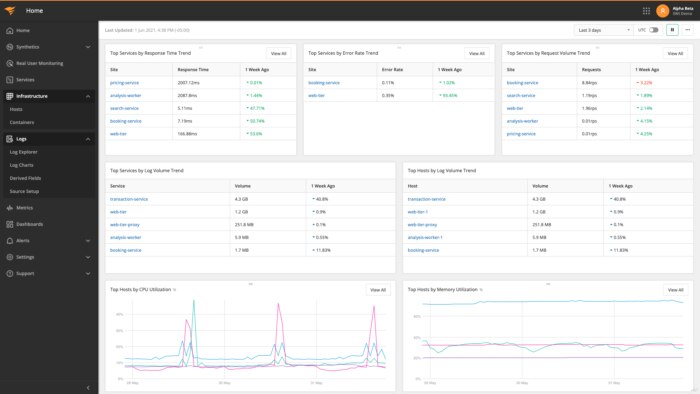
Integrating AppOptics and Loggly provides enhanced visibility into your applications’ health and performance. Together, these tools can filter logs to help you better understand latency issues and identify their root cause quickly. With this integrated suite, teams can instantly view a host of IT metrics in a single interface.
Besides improving the troubleshooting experience, both solutions substantially eliminate the risks and challenges associated with the manual log monitoring processes. Leveraging these tools together, operations, development, and quality assurance teams can become more flexible, agile, transparent, and efficient in their development and production processes. Django performance monitoring is simplified with the detailed performance metrics, distributed trace summaries, insightful reports, and advanced searching capabilities of both tools.