Technical Resources
Educational Resources
APM Integrated Experience
Connect with Us

Modern IT environments consist of multiple web servers and applications, and this can produce a massive stream of events. Deciding how to monitor all these logs can be a big challenge.
Analyzing massive volumes of logs isn’t easy, and teams can struggle to lower their mean time to resolution (MTTR) with traditional tools while trying to detect and resolve application and server issues in real time.
Manually monitoring an endless stream of events is impractical. To streamline troubleshooting, teams configure various tools for search, alerts, visualization, etc. This takes a lot of time and makes it difficult to coordinate efforts.
If you’re looking for an advanced HTTP log file analyzer for your web servers, SolarWinds® Loggly® can help. It offers a simple approach to log management with cloud-based log aggregation and analytics. You can stream all types of text-based structured and unstructured logs to Loggly using common scripts. It doesn’t require you to install an agent and allows you to get started quickly. With all your logs in one place, you can easily correlate various access and error logs to get to the root cause of issues. Loggly’s advanced analytics features can also help you improve situational awareness and maintain high availability in live environments.
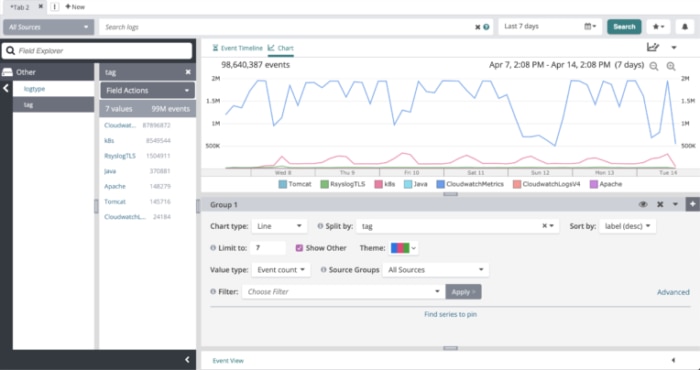
As an advanced HTTP access log analyzer, Loggly allows you to search through massive log volumes and get near-instant results for your search queries. It automatically parses your logs into specific fields, and you can define custom parsing rules to extract useful information. As the incoming logs are parsed, they can be analyzed using the Dynamic Field Explorer™, which provides a structured summary of the logs under various fields. Additionally, it helps you extract and refine information from the logs without typing multiple queries.
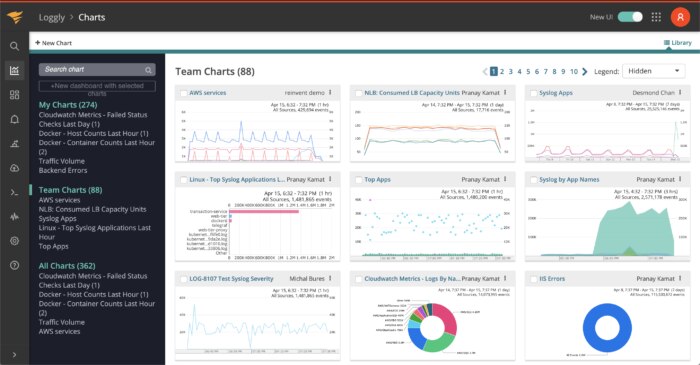
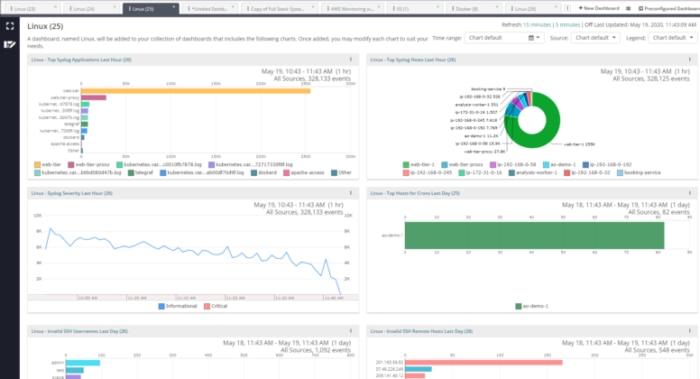
Loggly allows you to troubleshoot effortlessly, with several features and integrations with common tools used by DevOps teams. Loggly offers multiple preconfigured dashboards to help you monitor your web server’s health. You can also create custom dashboards to monitor your environment using different types of charts. These dashboards provide a quick overview of your environment by visualizing key performance and usage statistics. To keep your team on the same page, you can share your dashboards with different access rights. Moreover, Loggly integrates with tools like Slack, Microsoft Teams, JIRA, and GitHub, allowing your team to collaborate and resolve issues efficiently.