Technical Resources
Educational Resources
APM Integrated Experience
Connect with Us
With multiple servers, systems, and applications, logs accumulate very quickly. Managing huge volumes of fragmented log data across the distributed environment can be taxing, complex, and error-prone.
Traditional Java error log analyzers are not equipped to analyze logs from multiple sources and can get sluggish with rising log volumes. Inadequate log search and analysis functionality make it more challenging to get to the root cause of issues.
Analyzing Java error logs can be complex in the absence of advanced visualization tools. Inability to get a quick overview of the distributed environment and lack of intelligent insights further delays troubleshooting.
SolarWinds® Loggly® offers a centralized log management and analysis. It is a cloud-based solution designed to centrally manage all types of structured and unstructured logs from multiple sources for providing better visibility across the distributed environment.
Loggly is easy to set up and supports agentless architecture that eliminates the need to install an agent for sending logs to Loggly. You can seamlessly send your Java logs to Loggly using Log4j. Further, Loggly also supports automatic log archiving to facilitate various compliance and regulatory requirements of your organization.

Loggly offers advanced search and analytics features to expedite Java error log analysis with minimum efforts. It automatically parses different types of logs into various fields to help you derive useful information from massive log data. This enables you to get near real-time results for your search queries.
Further, the Loggly dynamic field explorer represents the structured summary of parsed logs, that allows you to simply click and browse through various fields without typing multiple search queries. The Loggly surround search feature helps you analyze Java logging errors by inspecting all events before and after a critical event across your distributed stack with a single click.

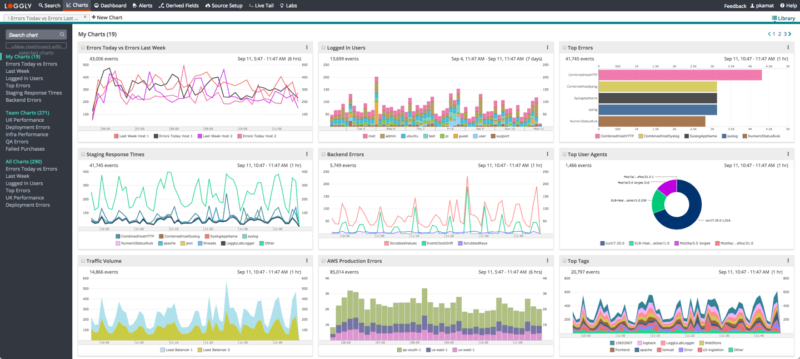
Loggly offers pre-configured dashboards for monitoring Java logs. You can start analyzing your Java error log without wasting time and effort while configuring multiple open-source tools for visual analytics. You can use different types of charts to visualize your Java logs and track recurring patterns, important trends, and spot anomalies easily. It offers a single click option to club the related charts for creating a customized dashboard.
Further, Loggly allows you to share these dashboards across your team to ensure everyone is on the same page. As an advanced Java error log analyzer, Loggly provides seamless integration with widely used notification services like Slack, HipChat, and PagerDuty for alerts.