Technical Resources
Educational Resources
APM Integrated Experience
Connect with Us

In large organizations there are numerous servers, endpoints, and applications, each of which can generate a large volume of logs. Ensuring all these logs are reliably captured and analyzed isn’t a simple task.
As organizations grow in scale and complexity, it becomes difficult to sift through a large volume of logs, correlate events, and pinpoint issues in the sea of data. Teams lack advanced tools to simplify log searching and analysis.
Teams need to visualize their logs to capture anomalies and identify significant trends. To meet these requirements, they rely on multiple open-source tools, which can be difficult and time-consuming to configure and manage.

SolarWinds® Loggly® allows you to stream your text-based logs to the cloud using simple scripts for centralized management and monitoring. Because it’s a cloud-based service, you don’t have to worry about setting up and maintaining a logging server, and you can get started with a few simple steps. Furthermore, Loggly has an agentless architecture, which means you don’t have to install any software for log collection. Centralized monitoring gives you a comprehensive bird’s-eye view of your environment so you can easily correlate events and resolve issues faster.

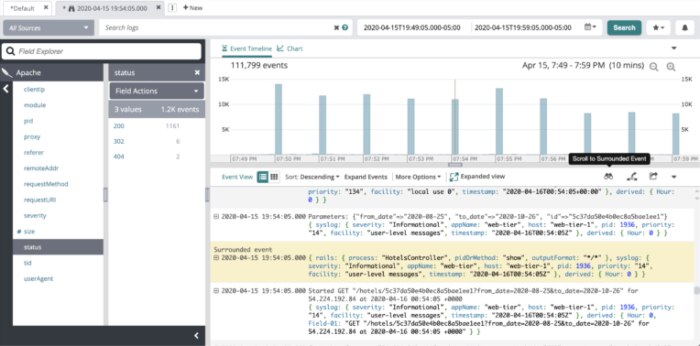
Loggly helps you sift through a large volume of logs and get near-instant results for your search queries. It automatically parses your logs into various fields and allows you to define custom parsing rules for log types not supported by default. As incoming logs are parsed, they’re updated in the Dynamic Field Explorer, delivering a simple approach to analyzing logs. This adds significant simplicity to the log search tool, as it allows you to click and browse fields of interest without typing complex queries. You’ll also find the surround search feature in Loggly highly useful in troubleshooting, as it identifies logs immediately preceding and following an entry of interest.

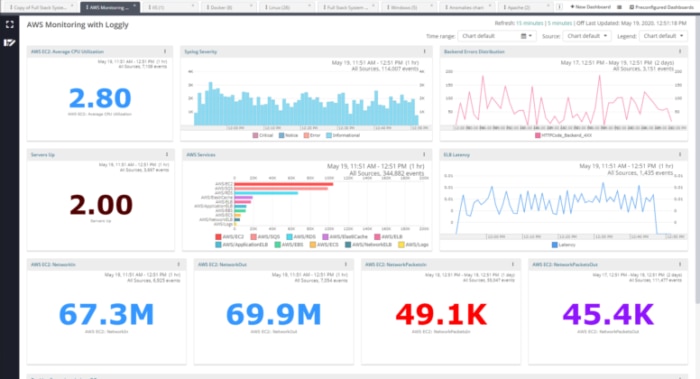
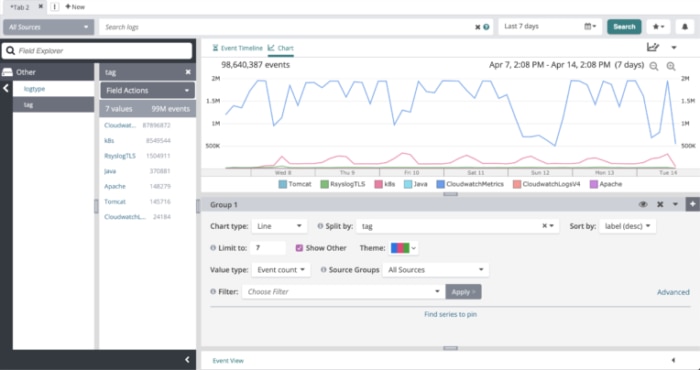
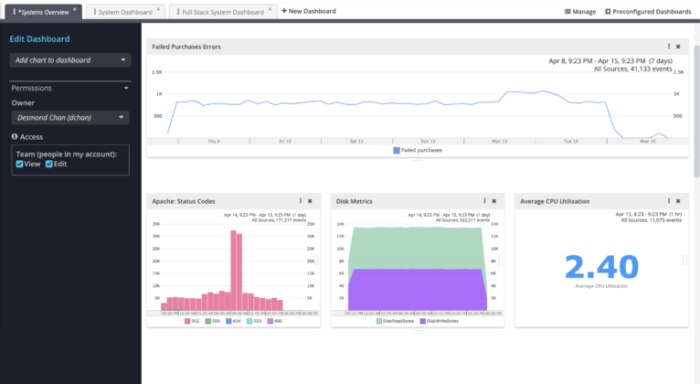
Loggly helps you visualize your search results using various types of charts. You can group charts to create a dashboard and share it across teams. All the charts in a dashboard can be synced to a common time frame in a single click, and you can compare events over a period using the timeshift feature. Furthermore, you can choose a preconfigured dashboard, which you can set up in a single click. With easy visualization, you can capture hidden trends in the data and spot issues in a single glance. This can save crucial minutes in troubleshooting bottlenecks in a live environment and help you reduce your mean time to resolution (MTTR).