Technical Resources
Educational Resources
APM Integrated Experience
Connect with Us
Logging Ruby files and correlating the data with other logs becomes challenging as you scale up your environment. In distributed setups, it is not easy to handle spikes in log volumes.
Traditional tools for Ruby on Rails logging offer limited flexibility in searching and analysis of logs. In the production environment, such tools can fail to assist troubleshooting in real time.
Configuring multiple open-source tools to aggregate, analyze, and visualize logs is a challenge. It takes time and effort to make efficient use of all such tools for troubleshooting.

Cloud-based centralized logging allows you to efficiently and reliably store, monitor, and analyze your logs with minimal effort. It allows you to correlate various application and infrastructure logs together to resolve issues faster.
SolarWinds® Loggly® offers a quick setup and allows you to start Ruby logging without the need to install an agent. You can use Logglier Library to send Ruby logs to Loggly, while Rails logs could be sent over syslog. As logs get past the retention period, Loggly gives you the option to automatically archive them on AWS S3 buckets for meeting your compliance or other regulatory purposes.

Loggly offers a seamless experience for log analysis and monitoring with powerful search and automated parsing. You get quick results for your search queries, no matter how many logs you sift through.
With automated log parsing, Loggly can structure your logs into various fields in its dynamic field explorer. This helps ensure you don’t have to run multiple searches to browse through your logs and can click and view fields of your interest. The intuitive workflow adds significant agility to your troubleshooting tasks.

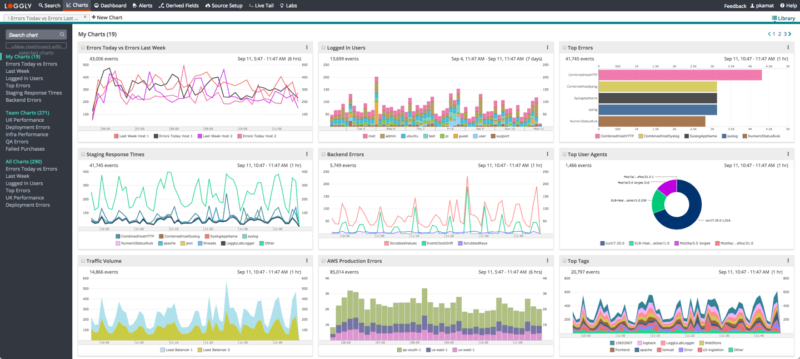
Loggly offers advanced charts and dashboarding to visualize your search results and spot important trends and anomalies faster. You can also use a pre-configured dashboard from Loggly to monitor your Ruby on Rails applications. The dashboard provides a quick overview of your environment and can be shared between multiple team members.
You can sync all charts in a dashboard with a single click and perform comparisons over a period with the timeshift function. In case you want to include a dashboard in any of your reports, you can also download it in the form of a PNG image. With all these integrated features, you can collaborate easily and troubleshoot issues faster.