Technical Resources
Educational Resources
APM Integrated Experience
Connect with Us
In a highly distributed environment, teams can struggle to manage a large volume of logs. The native SCCM log reader offers limited help in the storage and archival of logs.
SCCM logs are flat files, can vary in their syntax, and are difficult to parse. You may need to look for manual workarounds for SCCM 2012 event log monitoring and analysis.
It is not easy to monitor text log files, and oversights can lead to a bigger disruption. While visualization of logs can solve this challenge, you may lack dedicated tools for the purpose.

Your Windows and SCCM logs can hold invaluable information about your organization’s distributed IT environment. However, many times these log files may get deleted, and it can impact your ability to trace down the root cause of a major issue.
Centralizing and backing up your logs with a cloud-based log management service like SolarWinds® Loggly® increases the reliability of your log data. Loggly accepts a wide range of logs from different types of OS, servers, applications, endpoints, and networking devices. Loggly is simple to set up and doesn’t require any agent for the collection of logs.

Unlike the traditional SCCM log viewer, Loggly offers advanced features for search and analysis of logs. It can automatically parse a wide range of log files, making them ready for deeper analysis. With its interactive search, you can sift through a large volume of log files and get near-instant results for your queries.
The Loggly dynamic field explorer can significantly improve your troubleshooting speed as it summarizes useful information from your logs, that can be accessed without any trial-and-error searches. You can simply click and browse through your logs.

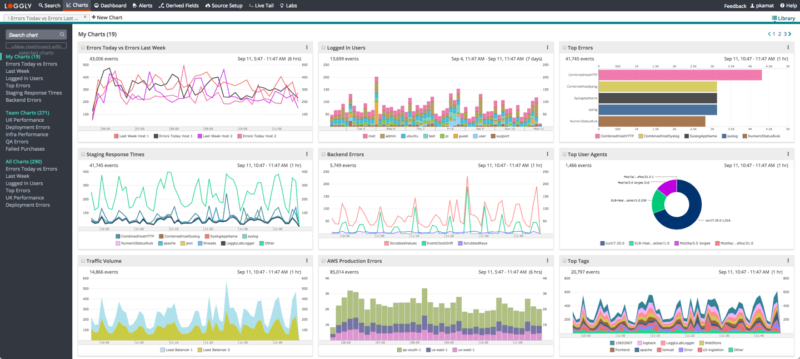
Loggly allows you to extract insights from your logs quickly with its advanced visualization features. You can plot charts for your search results and group them to form a dashboard. The charts can be easily synced to a common time with a single click.
You can also use the Timeshift function to compare charts over a period. There are several pre-configured dashboards available to help you get started. The charts can be dragged and resized, and you can project them on a large screen in your command center. With a visual overview, your team can quickly spot any deviation or recurring patterns in your environment.