Technical Resources
Educational Resources
APM Integrated Experience
Connect with Us
Modern organizations operate in a distributed environment, with several servers producing a large volume of logs. Teams using traditional server log analyzers can struggle to manage such workloads.
Traditional methods for logging individual servers fail when teams monitor multiple servers. Teams can also struggle to analyze and correlate information from different types of servers.
It is not easy to continuously monitor different servers with text-based logs alone; teams need advanced visualization tools to monitor their environment. However, configuring these tools can be a hassle.

SolarWinds® Loggly® offers cloud-based log aggregation and analytics, which can significantly reduce your time and effort in analyzing the server logs. With centralized monitoring, Loggly allows you to easily extract and correlate information spread across numerous server, infrastructure, and application logs.
Unlike other server log analyzers, Loggly has an agentless architecture and allows you to collect logs with minimal configuration. You can analyze Apache, Linux, Windows, IIS, NGINX, and any other text-based log using Loggly. Further, Loggly documentation provides adequate help and reference scripts for log ingestion and solving common challenges.

In modern 24/7 live environments, teams need tools that provide real-time insights and allow faster troubleshooting to reduce downtimes. Loggly meets these requirements by offering a powerful search feature that helps you get near-instant results for your queries.
It also automatically parses your logs into various fields to enable quick extraction of information. You can browse through your server logs using the dynamic field explorer which provides a guided search experience and helps you spot anomalies easily.

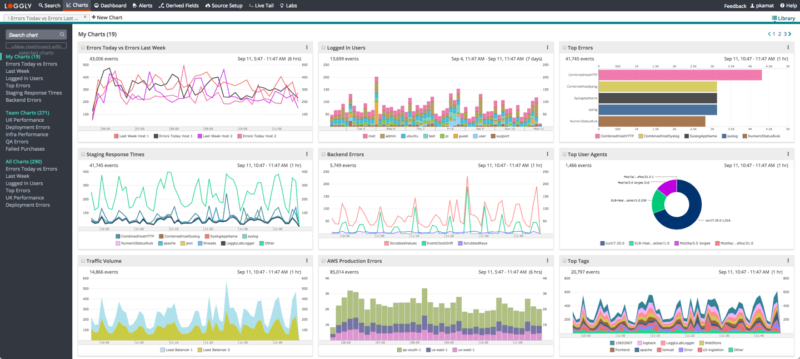
With Loggly, you don’t have to configure external tools for the visualization of logs, as it offers several pre-configured and customizable dashboards for monitoring. You can install Apache, Linux, IIS, and NGINX dashboards in a single click.
These dashboards can help you get a quick overview of your servers’ performance and usage levels with different charts tracking key metrics. You can also sync all charts in a single click and perform comparison over a period with the timeshift function. The dashboards can be shared with team members, and you can also download a visualization in PNG format to include it in your reports.