Technical Resources
Educational Resources
APM Integrated Experience
Connect with Us
Commands like tail and less require multiple flags, inputs, and interfaces, which can complicate getting the log output and format you want. With separate tools for tailing logs and analyzing, it becomes difficult to watch a file and search at the same time.
Traditional tools for tailing logs either do not support multiple log sources or require complex configuration, both which can prevent you from getting a centralized view of the tail data.
Most tailing tools don’t include advanced search or formatting options, so teams are left scrolling through log tails without any context or clues. These tools don’t have rich collaboration or reporting features, which can make it difficult to share data among team members.
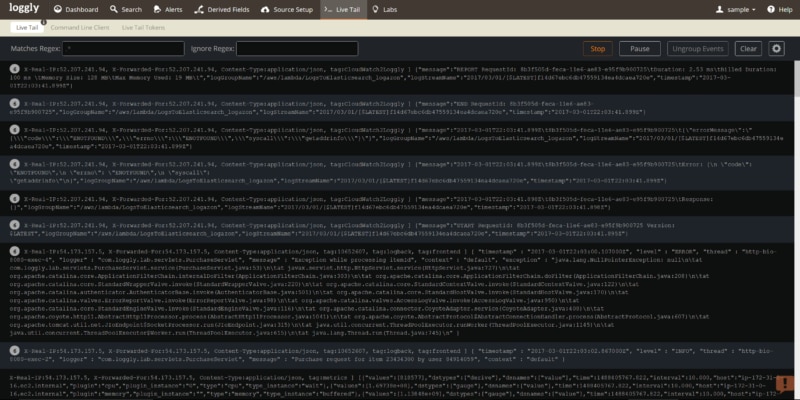
The SolarWinds® Loggly® live tail feature provides abilities similar to the classic log tail (tail -f) command; however, it is more powerful. The browser version allows you to monitor all log data sent to Loggly in a unified manner in real time using your web browser.
This feature makes it remarkably easier for the DevOps team to monitor new code rolled out to production; you don’t have to switch between different tools for tailing, alerts, and the visualization of logs. In addition to the browser version, live tail is also available as a command line client for Mac OS X, Linux, and other Unix-type and Windows operating systems.
Loggly live tail allows you to monitor all your log data in a consolidated form and in near real time. Loggly is a cloud-based log management solution which aggregates logs from multiple sources and enables consolidated log analysis across your distributed stack.
With configurable pattern-based filtering and color-coding, you can focus on specific types of event to quickly identify issues. Loggly live tail can group similar events together to allow you to see patterns quickly. You also have the option to pause the log tail stream to expand and view group items, if you want additional research to pinpoint the issue.
Loggly enables easy collaboration between team members to help a team troubleshoot issues faster. Loggly supports sending live tail output to a Slack or HipChat chat room, so the entire team can see the log output.
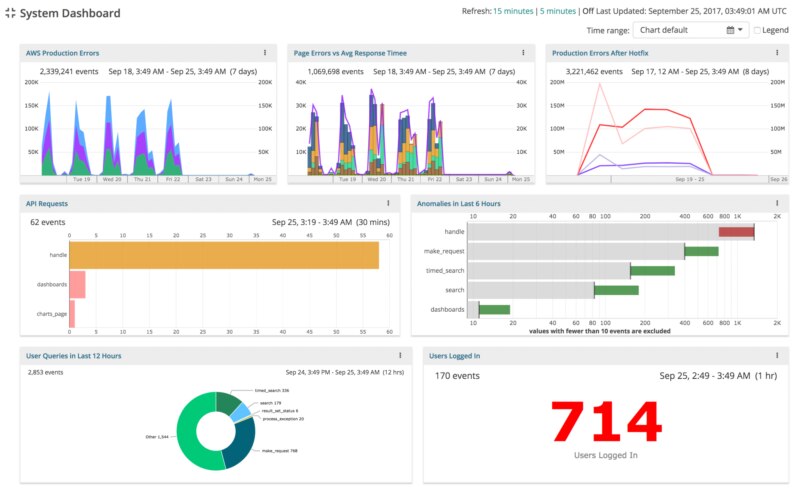
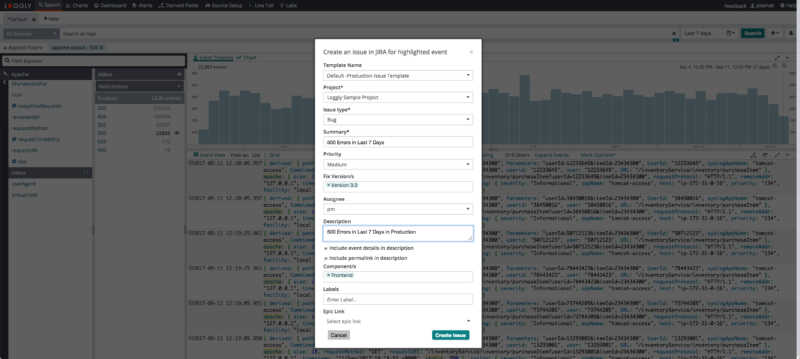
The Loggly Jira integration supports creating and updating Jira tickets directly from the Loggly interface, so it’s easy to share tasks across the team, capture troubleshooting steps and best practices, and collaborate on finding and fixing issues. The dashboards in Loggly are also easily shared and built for interactivity, allowing team members to explore the data and drill down into the logs.