Technical Resources
Educational Resources
APM Integrated Experience
Connect with Us
Keeping Linux machines up and running requires you to vigilantly monitor the health of your systems. Logs are one of the best ways to follow what’s currently happening with your services and to build a bigger picture about what has happened over the last few days or weeks. Did the latency of requests to the LDAP server suddenly go through the roof last Friday? How many HTTP 404 errors per day do users encounter when accessing the website? You can answer these questions by monitoring your Linux logs.
So how should you be managing your logs? This article provides you with a list of tools, tips, and best practices to follow to ensure your logs are always available, stored safely, and easy to work with.
It’s next to impossible to use logs from multiple services to troubleshoot issues if you haven’t included a timestamp in the log message. Many common log formats automatically include one for you, as timestamps make it much easier to see the order of events leading up to the point in time you’re interested in. If some of your services and tools allow you to specify a customizable log format, it’s a great idea to make sure the timestamp format is the same across every tool.
And don’t forget time zones—with a geographically distributed team, it’s easy to forget different teams use varying time zones and 9:00 a.m. in one data center facility is 5:00 a.m. on the other side of the ocean. The best solution is to choose a standard time zone (UTC works well for this scenario) and use it diligently throughout your monitoring infrastructure.
Valuable information is buried deep inside your logs, and you need to have a way of extracting it. sed and awk are stalwart command-line tools capable of manipulating plain-text log files to find the information you need for troubleshooting and understanding your systems. sed operates on files one line at a time and can insert, delete, and transform text. It’s often used to discard unwanted elements of a log message and print the part you’re interested in. For example, suppose you have a custom log entry containing information about a database access:
2020-04-02T14:09:58+00:00 [server1] “SELECT * FROM PAYMENTS”sedYou can use sed to strip away everything but the server name by doing this:
cat logfile.txt | sed -e 's/.*\[//' -e 's/\].*//'awk is another powerful tool providing a programming language for data processing. It also works on files one line at a time, and you can combine awk with sed to summarize data and print tables and statistics.
Storing huge volumes of data inside a single log file can start to slow down your searches if your tools are unable to cope. Instead, rotate your log files either at a specific interval—every day, for example—or once those files reach a certain size. You can use logrotate to automatically move your log files and avoid having any of them become unmanageable because they’re so large. This tool can handle rotation and can be configured to handle compression and removal. Additionally, it can mail your log files to a remote destination.
Here’s an example logrotate configuration file designed to rotate the /var/log/mail.log file every week and keep the last two weeks of logs around:
/var/log/mail.log {
weekly
create 0664 root utmp
minsize 1M
rotate 1
}
Some services can be overly chatty and produce thousands of log messages every minute. This data generation can easily exhaust your space if you’re storing your log files on a disk. Unfortunately, fixing this problem isn’t always as simple as turning the logs off, as they can be essential for troubleshooting and diagnosing problems in production.
Rather than disabling these log messages, you can use rate limiting to slow down the rate at which log messages are sent and avoid overloading your system. Rate limiting features are available with most logging services and libraries, including rsyslogd and SolarWinds® Loggly®.
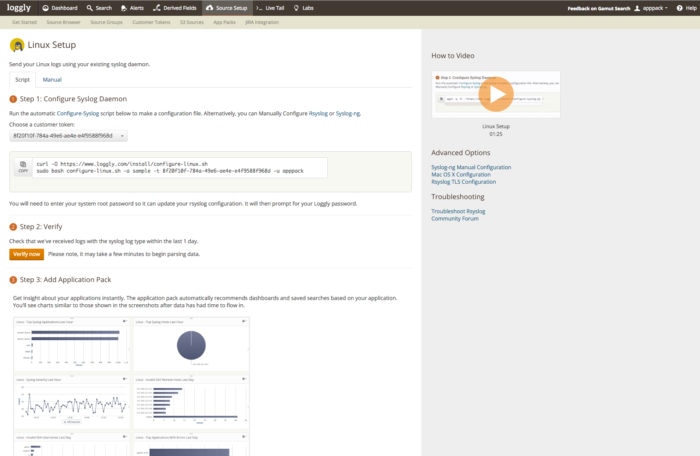
If you’re only responsible for a few servers, then it may be practical to SSH into each one when you want to inspect their log files. But with the rise of containers and microservices, this is a legacy practice incapable of scaling for most ops teams. Instead of leaving logs on individual machines, you should take advantage of syslog servers such as rsyslogd—which is widely available on Linux machines—to route logs to a central place. Once your logs are there, it’s much easier for the entire team to search through the logs for every service.
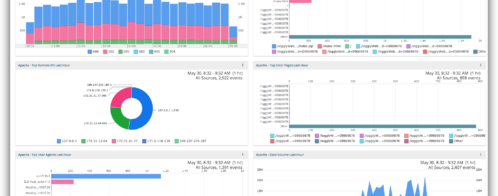
By aggregating your logs, you can also retain them for as long as you need. This is valuable for producing graphs and charts over long stretches of time to understand how your apps and services perform. And if you have audit policies in place, keeping your logs stored in a secure location can help you maintain compliance and safely purge logs when they’re no longer needed.
If you’re monitoring security-related infrastructure such as access and credential services or infrastructure with identifiable data, then your logs almost certainly contain data you want to keep private. This is why you should transmit your logs using a cryptographic protocol like Transport Layer Security (TLS). Communicating over TLS ensures your connection is private and attackers can’t eavesdrop on your data and steal your sensitive log messages.
Many syslog servers, such as the rsyslog-gnutls package or cloud-based servers like Loggly, support sending log messages using TLS. Using TLS requires you to create or download the necessary certificates to establish a secure connection between your sending machine and the log server. Services such as Loggly provide their own certificate authority (CA) certificates you can download into a directory on your machine and configure rsyslog to use.

It’s easy to get overwhelmed when monitoring logs across more than a handful of machines if you don’t follow the tips, tricks, and best practices laid out in this article. Wrangling large log files is much easier once you enable log rotation to keep the size of individual log files manageable, and you can troubleshoot issues much faster if every log message includes a timestamp with a consistent format using the same time zone. Having the venerable sed and awk tools in your back pocket will help make sure you can always extract the information you need from log files no matter what format they’re in.
Some services go too far and communicate too much information. Since it’s not always possible to disable logging, you can make use of rate limiting to reduce the number of messages those services can send within a given time.
The only way to get a holistic view of your apps, services, and infrastructure is by storing your logs in a central place. When those log messages are in transit, you don’t want them to fall into the wrong hands. It’s a good idea to establish a secure communication channel between the machine and the log server by using the TLS cryptographic protocol.