Technical Resources
Educational Resources
APM Integrated Experience
Connect with Us
When developing software, the initial deployment is only the first step. As your software gains users, it’ll be important to understand what’s going on with your applications and how they’re being used. With a cloud provider such as Microsoft Azure, you have plenty of options in terms of reporting metrics within your applications. In fact, your head will probably spin the first time you go through the possibilities, and you may find yourself with a lot of decision fatigue as you consider what to report.
Fortunately, there are several tools available today that make analyzing this data much simpler. Azure provides means to do this with its own Application Insights, but you may find you want something with more features. Azure Application Insights is a serviceable option, but it can take some time to get started and fit it into your workflow. In this case, SolarWinds® Loggly® has plenty of capabilities designed to help you manage the data coming in.
In this guide, we’ll walk through some of the base capabilities to help you go through application logs. We’ll focus on two major aspects:
– Being able to view and search logs
– Setting up alerts based on log contents
Let’s look at how Loggly can help monitor Azure logs.
In this guide, you can go through the major categories for ways to use Loggly with your Azure-hosted applications. If you’re looking to try Loggly out, you may want to set up a test environment yourself to get a feel for its capabilities firsthand. This way, you can experience the steps required to get Loggly connected to an Azure-based application using a minimal application. This is useful if you’re already hosting something in Azure, as you’ll have some practice getting connected and viewing data. You’ll need to do a few things to go through those steps in this article.
1. If you haven’t already, create an Azure account, then create a function app to serve as your testing application.
2. Sign up for a free trial account of Loggly, which provides access to the logs for the function app above.
3. Connect the function app logs using an Event Hub and a second function app as shown in this post.
The above steps will give you the means to interact with and view the different events that correlate to different types of viewers accessing the function app above. Even if you don’t do this, this guide should still help you understand how Loggly can monitor your Azure resources. Assuming you find Loggly fits your needs, you can come back to this section to get a high-level view of the Loggly and Azure connection steps.
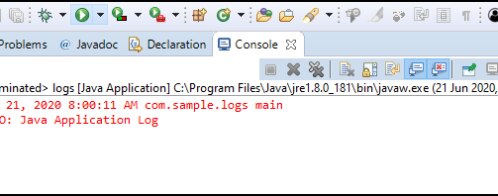
The first useful step is viewing the general logs being passed into Loggly. With the function app we’ve connected, this will show the application logs alongside additional information such as the IP address of the client sending the logs (which is useful if your software is hosted on multiple servers).
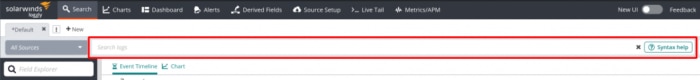
Opening Loggly automatically takes you to the Search tab:
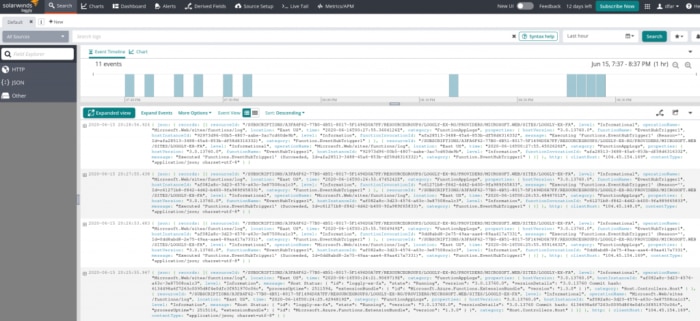
This can become overwhelming pretty quickly. With even a moderate amount of data, you may find going through the data difficult. But Loggly provides ways to view this data easily. Some of the most common ways of manipulating logs include:
– Searching logs
– Filtering log data based on JSON results
– Saving frequent searches
This is probably the most common way to use a log management tool such as Loggly. Loggly provides the means to quickly search a large number of logs for specific terminology, such as a specific error code reported by a user. Just use the search bar at the top left.
Loggly will quickly go through the logs based on the timeframe provided and return anything with matching data. In addition, you can use Loggly Search Query Language for more complex searches. The Search Query Language allows for searches using wildcards, regular expressions, and more. Clicking the “Syntax help” button will provide more information on how to use this. As you start working on setting up saved searches (covered in a section below), using the Search Query Language may become very handy.
But what if you’re not exactly sure what you’re looking for? Another option is to filter information by JSON key.
We can go through the logs based on a specific key in the logs. Having this listing is useful if you’re looking for different values based on a key to review. For instance, you can view the different log levels provided by the application and filter accordingly. Another way to think of this is browsing through the data at a high level as opposed to looking for something more specific.
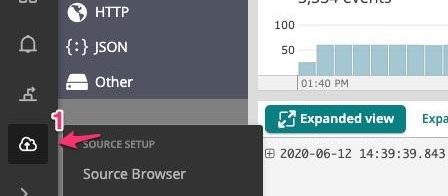
In this case, let’s look at error level logs to view any logs providing error data. In “Field Explorer” on the left side, I click on “JSON,” then “level,” and finally “Error.”
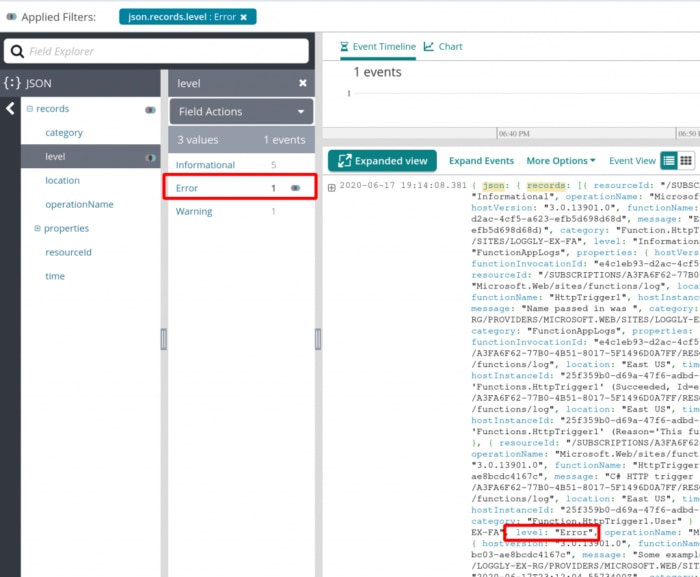
Now I can see the collections of records with the key “level” and the value “Error,” which I was able to browse through using the Field Explorer. I had other options such as “informational” listed as well, giving me the option to select any of those.
Between searching and filtering, you’ll probably find that you’re using certain searches repeatedly. You can save your searches to use again later, which comes in handy when repeatedly reviewing logs with certain criteria.
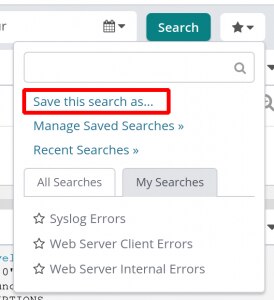
Saving a search is easy. All you need to do is click on the star at the right side and click “Save this search as…”
Now that we’ve gone over the basics in viewing and searching logs, let’s go deeper into the capabilities of Loggly and see how it can help you monitor Azure logs.
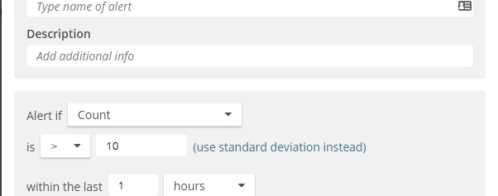
Loggly can proactively alert you about issues that come into play. Let’s set an alert for any time a certain threshold of “Error” level logs is reported in the application. This allows the operations team to learn about issues ahead of time. In turn, they can solve problems before they become a larger issue.
Let’s use the saved search created above. We can either click the “Save then create alert” button when creating the saved search or create an alert from the “Alerts” tab.
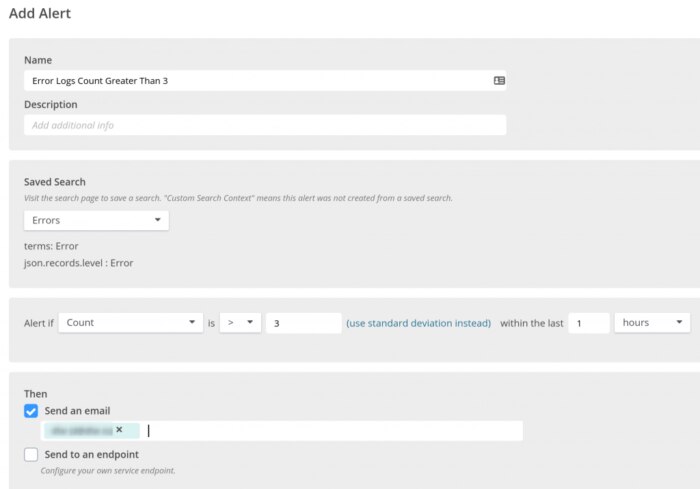
This alert will check to see if there are more than three records with error logs within the last hour. An alert like this would be handy for letting Operations know there’s a potential issue with the system, such as a bad deployment or an external dependency issue.
Once the threshold is hit, Loggly can either send an email or send information to an endpoint, allowing for capabilities like integration with Slack.
Hopefully, this guide helps you understand the ways Loggly can assist with monitoring your production-based applications in Microsoft Azure. Best of all, you can create a free account with Loggly now and get started quickly.
This post was written by Dave Farinelli. Dave is a senior software engineer with over eight years of experience. His specialty is in providing enterprise-level solutions for healthcare and insurance clients. Dave holds a B.S. in computer engineering from Kettering University in Flint, Michigan.