Monitoring Ansible Plays in Four Simple Steps
Today, it is not unusual for DevOps teams to have very complex software infrastructure involved in daily operations tasks: deployment scripts, sanity checks, multi-environment configurations, and a long list of other things. Continuous integration (CI) and continuous deployment (CD) come with a lot of benefits and an exponential increase in the number of moving parts. Of course, with every increase in complexity comes an equivalent increase in the probability of errors. As DevOps teams, we need a way to monitor our own tools and processes to achieve operations quality and reliability.
A key piece of that approach is quite simple: logging. Everybody uses logs to monitor software applications running in production. This is a cornerstone of healthy application. DevOps tools should be no different! We should monitor our DevOps activities in the same fashion we do for our products in production.
One of the flagship products used for server provisioning, CI, and CD in modern technology stacks is Ansible. We use Ansible and Jenkins to automate all CI/CD tasks at Loggly. In this post, we will describe how to manage and monitor Ansible operations using Loggly and stay ahead of issues in our provisioning/CI/CD operations.
How to Configure Ansible to Send Logs to Loggly
It’s actually quite simple to configure your Ansible server to send logs to Loggly. Here are the steps to take:
1) Create a Loggly account if you don’t have one already.
2) Configure your Ansible host machine(s) to send logs to Loggly. Depending on the operating system these hosts are running, the steps will be slightly different, but don’t worry. We have step-by-step guidelines for most modern platforms. The images below show an example for redirecting Ansible logs to syslog with syslog-ng.


3) Configure your Ansible server “ansible.cfg” for “log_path=/var/log/ansible.log” (or whatever path you intend to use).
4) Optionally, set the tag to label the name of the deployment-environment (e.g., QA, Staging, Production, etc.). See Image 1 to set tags with syslog-ng, or refer to this link for rsyslog. “appName” can also be used to differentiate logs of different applications running on the same server as shown in Image 2.
You can follow similar steps to configure all of your provisioning and app-deployment tools, including Jenkins, Rundeck, Puppet, Chef, Salt, or others, and benefit from having a single view of relevant log events with powerful analysis tools at your fingertips.
Best Practices for Ansible Logs
- Use Loggly tags and source groups to separate logs coming from different environments. For example, you may use this to separate logs from QA, staging, and production environments or to delineate different data centers or regions.
- You may have some logs that consistently show harmless errors (or the minor/known errors, which are scheduled to get fixed later). Don’t ignore them; rather, watch the patterns and create alerts if those errors start occurring more frequently than usual.
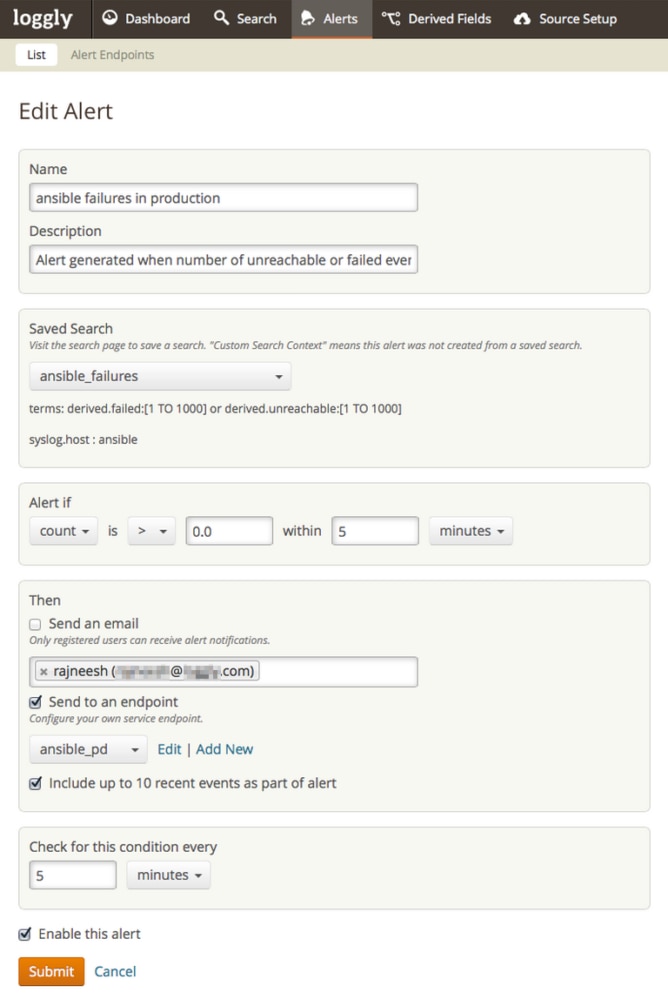
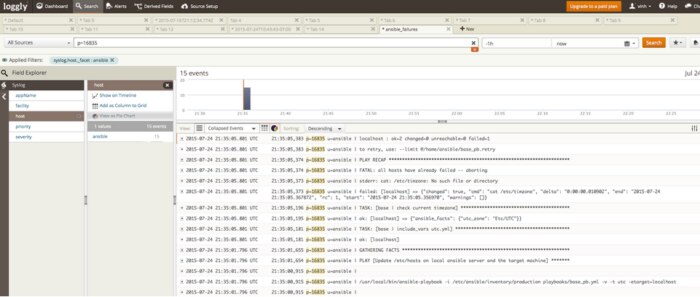
- After the execution of Ansible playbooks, they always end up with a statement like “ok=2 changed=0 unreachable=0 failed=1”. Make sure the “PLAY RECAP” has “unreachable=0” and “failed=0”. (See Images 3, 4, and 5). If your logs capture anything other than 0:
- Fire an alert
- Analyze the alert


Logging Automated Deployments Has a Nice Payoff
At Loggly, every run of every Ansible play gets logged. Armed with this information, we can:
- Know about all failures as soon as they happen. We send our Loggly alerts through PagerDuty so that the on-call person can take the appropriate actions. We can also configure alerts with HTTP endpoints, resulting in some automated responses, or an amazing self-healing environment. (We’ll share more on this in a future post.)
- Monitor deployments remotely without logging in to our company’s network or servers.
- Quickly see all of the modifications in production servers.
- Plot the trend of failures to understand how to prevent them in the future.
- Quickly set up our servers without needing to install any clients or agents, like most other monitoring tools need.
- Access logs/health-checks through APIs and integrate with other tools.
- Provide logs-access to other teams without compromising access controls on the Ansible server or production servers.
- With a log management solution like Loggly, there’s no need to run an extra client on the hosts, nor is there any need of installing and managing log-servers.
If you’re serious about DevOps, we highly recommend that you log and monitor the provisioning of servers, application-deployments, and health-checks after deployments using a centralized log management solution like Loggly. Once you get this solution under your belt, you can further extend its usage to other places, such as application logs.
Try it yourself and tell us what you think!
The Loggly and SolarWinds trademarks, service marks, and logos are the exclusive property of SolarWinds Worldwide, LLC or its affiliates. All other trademarks are the property of their respective owners.
Tim Elliott


