Technical Resources
Educational Resources
APM Integrated Experience
Connect with Us
Python logs contain information for both diagnostics, as well as audit purposes, and there could be millions of lines of log entries on multiple production servers. Managing all these logs isn’t easy.
While the Python logging module provides a convenient framework for emitting log messages, the amount of log data can be overwhelming and can lead to higher MTTR.
The Python logging module gives developers enough control to configure their logs and make them meaningful. Still, it is often difficult to get the big picture. Finding patterns in the data requires thorough and painstaking attention.

In modern DevOps environments, new applications and features are deployed more frequently than ever. In this scenario, log volumes can multiply at an unpredictable pace. Not every organization has a defined strategy to manage such logs and, at times, this can lead to loss of log data.
SolarWinds® Loggly® allows centralized management of all your Python logs, helping you achieve higher efficiency and reliable management of Python logging data. There is no need to put agents on your servers, since sending Python logs to Loggly is designed to be simple, and there are several ways to do it. Moreover, Loggly facilitates archiving those logs that have gone past their retention period. You can retain your logs on AWS S3 buckets as long as you want them for compliance or other purposes.

Loggly provides a powerful search feature that helps you quickly find relevant information from millions of lines of Python logs extending over a long period. The search interface is highly interactive and does not require a proprietary query language to sift through the log data.
For comprehensive log troubleshooting, Loggly also allows you to view all associated events across your distributed stack that have occurred just before or after any critical event. You can quickly pinpoint issues in your deployments and make necessary changes to resolve issues. Loggly also allows integration with popular notification services to deliver intelligent alerts.

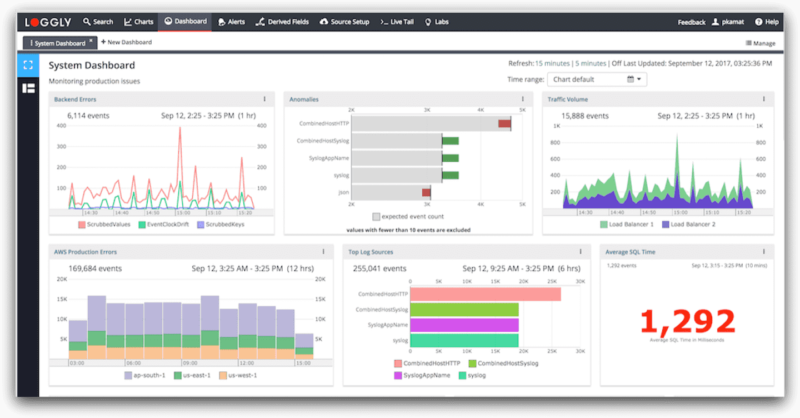
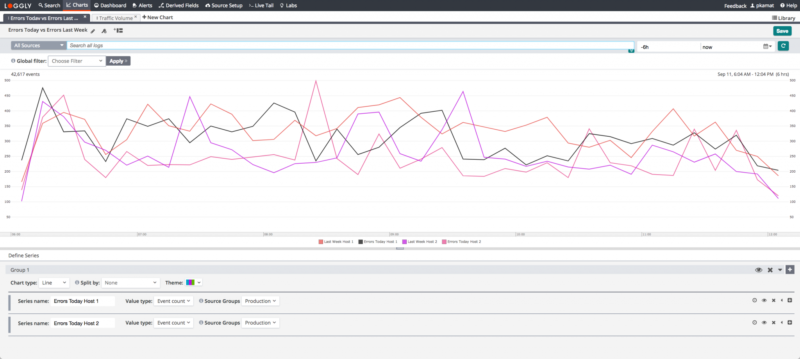
Loggly allows you to create interactive and shareable dashboards to visualize data with charts and collaborate with your team. You can create various types of charts for plotting time series and non-time series data related to your Python logs. These charts will help you analyze data with ease and display relevant information on KPIs and important metrics.
You can also sync all your charts to a definite timeframe (for example, the last hour) with a single click. Moreover, Loggly is extremely useful for anomaly detection. You can use the anomalies chart to identify unusual recurring patterns or any other strong trends. Such trends and patterns are usually hard to detect without visualization because they might not trigger your threshold-based alerts.