Bootstrapping business KPIs with your log management solution
The Need for Business KPIs Often Precedes the Ideal Resources
Even in big businesses, many software projects start fast and lean. Earlier this year, I found myself in a situation where I needed a data analyst but didn’t have one on board yet. So it was up to me, not a data analyst, to design and track a set of Key Performance Indicators (KPIs) that would help my team understand the success of how our new application was working and give us benchmarks upon which we could detect problems and understand where we needed to improve.
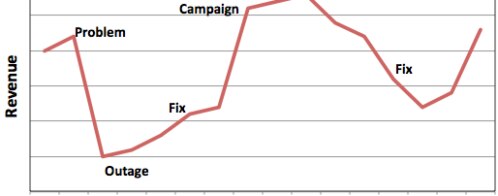
Fortunately, my development team had designed the app to log all relevant data for the KPIs I cared about. With the “raw truth” about what was happening in the product available to me, I was able to use my log management solution to create our launch dashboard. With this dashboard, my whole team was able to monitor the success of our application in real time.
Our KPIs Started Simple During Beta Period
During our beta period, we looked at metrics such as:
- The number of signups
- The number of people progressing through several defined steps in our conversion funnel
- The number of times certain features were used that are strong indicators of user engagement for my company’s app
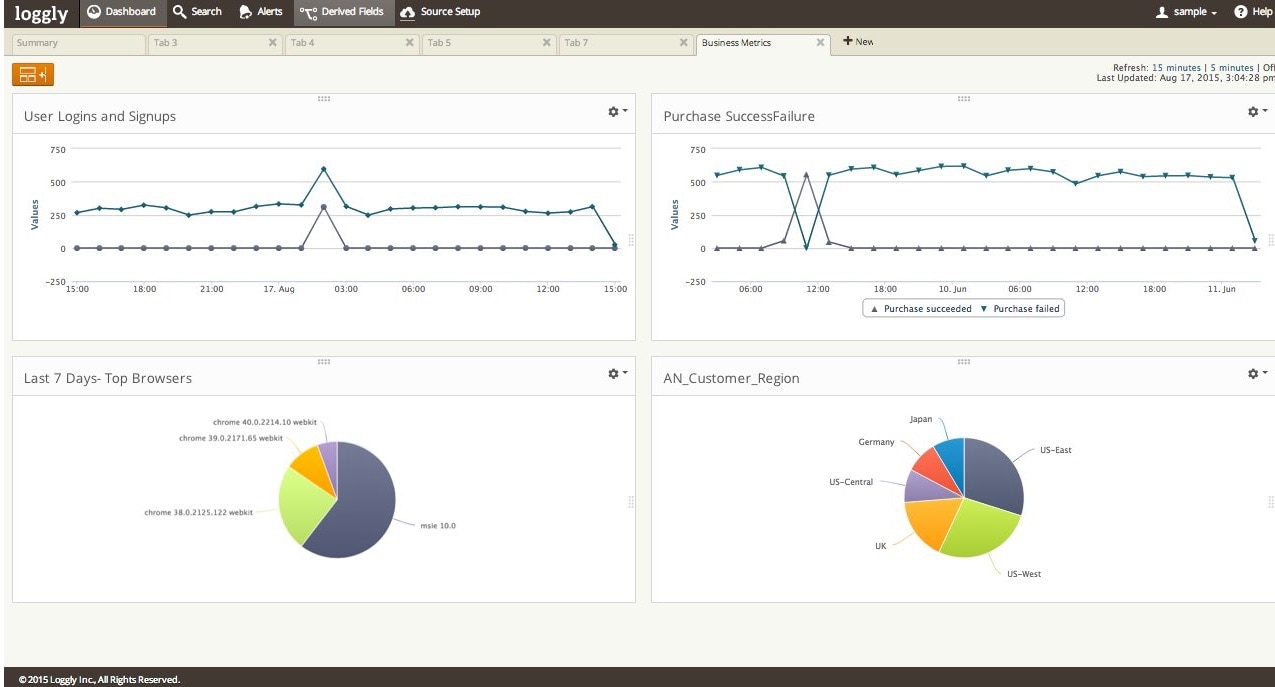
All of this data was available in our logs, and it took me just a few minutes to visualize the metrics in a dashboard using our log management solution.
To do this in Loggly, you simply:
- Log the metrics you want to track
- Use search and Loggly Dynamic Field ExplorerTM to create a view of each one
- Save your searches
- Put them on dashboards
Our KPIs Are Growing Up
Our log management solution was our constant companion during launch, not only helping us stay on top of potential issues but also giving our entire team updates on KPIs. Since launch, we have added more metrics and have put in place a full data warehousing and analytics infrastructure. I now have access to much more sophisticated analysis, including segmentation and cohort analysis using the same raw data that comes from our logs.
But here’s the important lesson for you: User data is invaluable, and you’re never too small to live without it. As long as you follow the right development practices, it doesn’t take much work at all to bootstrap business KPIs from your log data. Just give it a try!
The Loggly and SolarWinds trademarks, service marks, and logos are the exclusive property of SolarWinds Worldwide, LLC or its affiliates. All other trademarks are the property of their respective owners.

Michael Finney