Five Tips for Monitoring Your Cloud Application

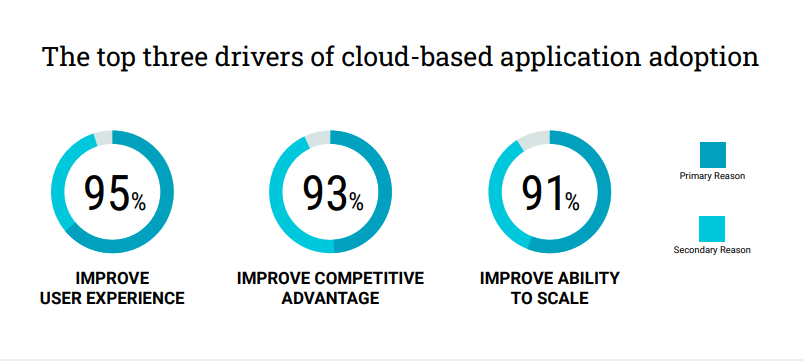
Page load time is inversely related to page views and conversion rates. While probably not a controversial statement, as the causality is intuitive, there is empirical data from industry leaders such as Amazon, Google, and Bing to back it in High Scalability and O’Reilly’s Radar, for example. As web technology has become much more complex over the last decade, the issue of performance has remained a challenge as it relates to user experience. Fast forward to 2022, and UX is identified as a key requirement for business success by CIOs.
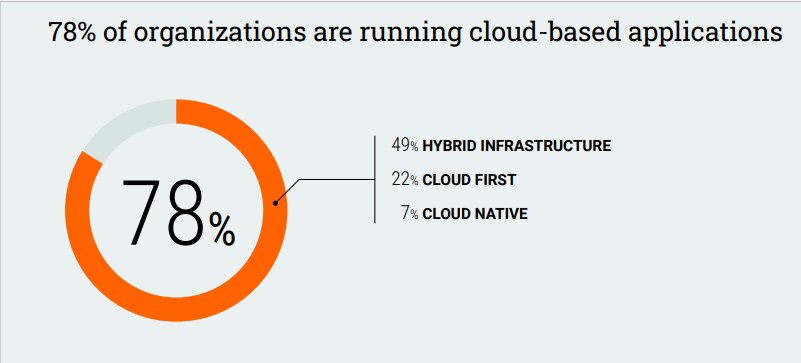
With the majority of applications now running in the cloud, the undeniable reality remains that performance impacts business, and it can represent a major competitive (dis)advantage. Whether your application relies on AWS, Azure, Heroku, Salesforce, Cloud Foundry, or any other SaaS platform, consider these five tips for monitoring SaaS services.
1. Realize the Importance of Monitoring
In case we haven’t established that app performance is critical for business success, let’s look at research done in the online retail sector.
“E-commerce sites must adopt a zero-tolerance policy for any performance issues that will impact customer experience [in order to remain competitive]” according to Retail Systems Research. Their conclusion is that performance management must shift from being considered an IT issue to being a business matter.
We can take this concept into more specific terms, as stated in our article series on Building a SaaS Service for an Unknown Scale. “Treat scalability and reliability as product features; this is the only way we can build a world-class SaaS application for unknown scale.”
End users have come to expect very fast, real-time-like interaction with most software, regardless of the system complexities behind the scenes. This means that commercial applications and SaaS services need to be built and integrated with performance in mind at all times. And so, knowing how to measure their performance from day one is paramount. Logs extend application performance monitoring (APM) by giving you deeper insights into the causes of performance problems as well as application errors that can cause user experience problems.
2. Incorporate a Monitoring Strategy Early On
In today’s world, planning for your SaaS service’s successful adoption to take time (and thus worrying about its performance and UX later) is like selling 100 tickets to a party but only beginning preparations on the day of the event. Needless to say, such a plan is prone to produce disappointed customers, and it can even destroy a brand. Fortunately, with SaaS monitoring solutions like SolarWinds® Loggly®, it’s not time-consuming or expensive to implement monitoring.
In fact, letting scalability become a bottleneck is the first of Six Critical SaaS Engineering Mistakes to Avoid we published some time ago. We recommend defining realistic adoption goals and scenarios in early project stages, and to map them into performance, stress, and capacity testing. To realize these tests, you’ll need to be able to monitor specific app traffic, errors, user engagement, and other metrics that tech and business teams need to define together.
A good place to start is with the Four Golden Signals described by Google’s Monitoring Distributed Systems book chapter: Latency, Traffic, Errors, and Saturation. Finally, and most importantly from the business perspective, your key metrics can be used as service level indicators (SLI), which are measures of the service level provided to customers.
Based on your SLIs and adoption goals, you’ll be able to establish service level objectives (SLOs) so your ops team can target specific availability levels (uptime and performance). And, as a SaaS service provider, you should plan to offer service level agreement (SLA). SLAs are contracts with your clients that specify what happens if you fail to meet non-functional requirements, and the terms are based on your SLOs, but can be negotiated with each client, of course. SLIs, SLOs, and SLAs are the basis for successful site reliability engineering (SRE).

For a seamless understanding among tech and business leadership, key performance indicators (KPI) should be identified for various business stakeholders. KPIs should then be mapped to the performance metrics that compose each SLA (so they can be monitored). Defining a matrix of KPI vs. metrics vs. area of business impact as part of the business documentation is a good option. For example, a web conversion rate could map to page load time and number of outages, and impacts sales.
Finally, don’t forget to consider and plan for governance: roles and responsibilities around information (e.g., ownership, prioritization, and escalation rules). The RACI model can help you establish a clear matrix of which team is responsible, accountable, consulted, and informed when there are unplanned events emanating from or affecting business technology.
3. Have Application Logging as a Code Standard
Tech leadership should realize that the main function of logging begins after the initial development is complete. Good logging serves multiple purposes:
- Improving debugging during development iterations
- Providing visibility for tuning and optimizing complex processes
- Understanding and addressing failures of production systems
- Business intelligence
“The best SaaS companies are engineered to be data-driven, and there’s no better place to start than leveraging data in your logs.” (From the last of our SaaS Engineering Mistakes)
Best practices for logging is a topic that’s been widely written about. For example, see our article on best practices for creating logs. Here are a few guidelines from that and other sources:
- Define logging goals and criteria to decide what to log. (Logging absolutely everything produces noise and is needlessly expensive.)
- Log messages should contain data, context, and description. They need to be digestible (structured in a way that both humans and machines can read them).
- Ensure that log messages are appropriate in severity using standard levels such as FATAL, ERROR, WARN, INFO, DEBUG, TRACE (See also Syslog facilities and levels).
- Avoid side effects on the code execution. Particularly, don’t let logging halt your app by using non-blocking calls.
- External systems: try logging all data that comes out from your application and gets in.
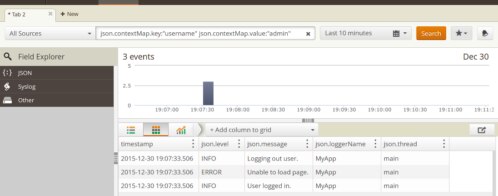
- Use a standard log message format with clear key-value pairs and/or consider a known text standard format like JSON. (See figure 4 below.)
- Support distributed logging: Centralize logs to a shareable, searchable platform such as Loggly.
Some of our sources include:

Every stage in the software development life cycle can be enriched by logs and other metrics. Implementation, integration, staging, and production deployment (especially rolling deploys) will particularly benefit from monitoring such metrics appropriately.
Logs constitute valuable data for your tech team, and invaluable data for your business. Now that you have rich information about the app that is generated in real-time, think about ways to put it in good use.
4. Automate Your Monitoring Configuration
Modern applications are deployed using infrastructure as code (IaC) techniques because they replace fragile server configuration with systems that can be easily torn down and restarted. If your team has made undocumented changes to servers and are too scared to shut them down, they are essentially “pet” servers.
If you manually deploy monitoring configuration on a per-server basis, then you have the potential to lose visibility when servers stop or when you add new ones. If you treat monitoring as something to be automatically deployed and configured, then you’ll get better coverage for less effort in the long run. This becomes even more important when testing new versions of your infrastructure or code, and when recovering from outages. Tools like Terraform, Ansible, Puppet, and CloudFormation can automate not just the deployment of your application but the monitoring of it as well.
Monitoring tools typically have system agents that can be installed on your infrastructure to begin streaming metrics into their service. In the case of applications built on SaaS platforms, there are convenient integrations that plug into well-known ecosystems. For example, Loggly streams and centralizes logs as metrics, and supports dozens of out-of-box systems, including the Amazon Cloudwatch and Heroku PaaS platforms.
5. Use Alerts on Your Key Metrics
Monitoring solutions like Loggly can alert you in changes in your SLIs over time, such as your error rate. It can help you visually identify the types of errors that occur and when they start. This will help identify root causes and fix problems faster, minimizing impact to user experience.

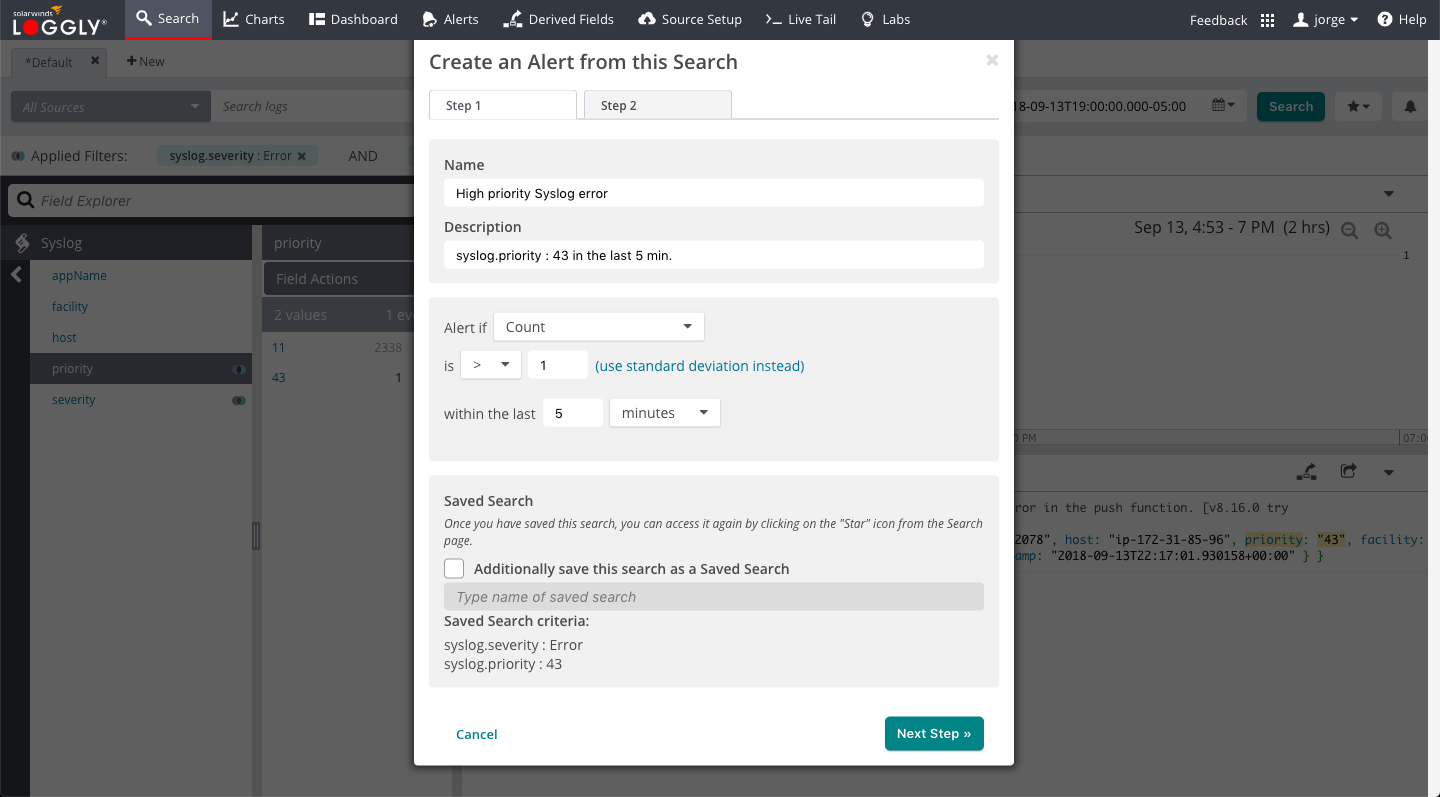
Custom alerts can be created from saved log searches, which act as key metrics of your application’s performance. Loggly even lets you integrate alerts to incident management systems like PagerDuty and OpsGenie.
In conclusion, monitoring your SaaS service performance is very important because it significantly impacts your business’ bottom line. This monitoring has to be planned for, applied early on, and instrumented for all the stages in the SDLC.
Additionally, we explained how and why correct logging is one of the best sources for key metrics to measure your monitoring goals during development and production of your SaaS service. Proper logging on an easy-to-use platform such as Loggly will also help your business harness invaluable intel in real time. You can leverage these streams of information for tuning your app, improving your service, and to discover new revenue models.
Sign up for a free trial of SolarWinds Loggly to start doing logging right today, and move your SaaS business into the next level of performance control and business intelligence.
The Loggly and SolarWinds trademarks, service marks, and logos are the exclusive property of SolarWinds Worldwide, LLC or its affiliates. All other trademarks are the property of their respective owners.

Jorge Orpinel