Four Stages for Successful AWS Resource Monitoring
AWS-based applications are becoming more and more complex, as companies try to take advantage of the full range of services available from Amazon. These applications have critical interdependencies, so it’s vital to monitor different AWS services simultaneously to keep systems running.
Many AWS monitoring tools are available in the market today, but no matter which you use, it all comes down to how well you plan usage of your selected solution, its effective implementation, and iteration after launch. In this article, we will cover a four-step framework to share some AWS monitoring best practices and help guide your approach to successfully monitoring your resources – as well as a general framework for future interaction and collaboration between teams.
Stage One: Do Prep Work to Understand Your AWS Monitoring Needs – and Your Current Reality
1. Find Answers to Some Exploratory Questions
- Are you also running an on-premise network? Do you want to monitor both environments with one tool?
- Can you use a SaaS solution for monitoring and logging? Are there any legal compliance requirements?
- If you already use a monitoring tool, is it capable of monitoring AWS?
- How difficult will it be to install new monitoring agents and remove legacy agents from all servers?
- What are some of the most important metrics you want to monitor?
This is not a complete list, but this type of upfront legwork can help you choose the right AWS monitoring product and create an implementation roadmap, helping save you time and money (and not to mention pain and lost sleep) in the long run.
2. Develop a Strategy to Tag AWS Resources
Monitoring tools make extensive use of tags. For optimal results, you must consider tagging when monitoring AWS resources. If you already have a solid tagging mechanism in place, that’s great. If not, make sure you follow a uniform tagging convention. If necessary, add extra tags to all your resources. Here are some examples:
| Tags | Can be used for |
| Application | Monitoring all resources of a particular application |
| Cost center | Monitoring costs incurred by different cost centers |
| Team | Monitoring resource usage by different teams |
| Geography | Monitoring location-based performance |
| Priority | Monitoring production versus non-production systems |
3. Plan Out Your Phased Implementation
Many people add all available metrics from their AWS fleet when starting with a new monitoring tool. But we believe doing so can overlook important metrics and create an inconsistent configuration.
The approach should be app-based and phased, with the most critical applications on-boarded first. An application can have many moving parts: URLs, DNS entry, firewalls, load balancers, app and database servers, S3 buckets, etc. For a holistic view of the application, all these moving parts should be included one by one until the application can be ticked off as fully monitored. Other applications should be on-boarded in the same way.
Stage Two: Gain Cross-Functional Alignment and Align on Protocols
1. Involve Different Teams in Your Org
Typically, monitoring is thought to be the operations team’s responsibility. But the best value in AWS monitoring – or any other sort of cost-bearing decision – is achieved when every related team is involved. It’s best practice to create a matrix showing each team’s name and responsibility for monitoring. For example:
| Team | Responsible for monitoring | Environment or scope |
| Service operations | – Overall application health and performance
– Act on alerts |
PROD, QA, STAGING |
| Product support or dev team | – User experience
– Page load time, API call time – Broken links |
PROD and non-PROD |
| Infrastructure team | – AWS infrastructure health like CPU, disk space, memory, swap usage, OS processes | PROD and non-PROD |
| Database team | – Anything related to database infrastructure and performance | PROD and non-PROD |
| Security team | – Web and application access logs, VPC flow logs, CloudTrail logs, AWS Config logs | PROD, QA, STAGING |
| Finance and billing team | – AWS billing
– Usage monitoring – Reporting |
Every AWS account |
2. Create an Incident-Type Matrix
Create a list of incident types for each AWS service and define their thresholds. For example:
| Resource type | Metric | Threshold value | Incident type |
| EC2 | Disk space | >=85% | Warning, P2 |
| Disk space | >=95% | Critical, P1 | |
| RDS | Memory used | >=70% | Warning, P2 |
| Memory used | >=85% | Critical, P1 |
Also, define what needs to be done when incidents happen:
- Does the monitoring system raise an alarm? How, and to whom?
- Does the application take any self-healing action?
3. Create a RACI Matrix
Like the incident types, create a RACI (responsible, accountable, consulted, informed) matrix showing who’s involved when incidents occur. Having such a matrix helps you quickly gather a troubleshooting team. For example:
| Resource type | Incident type | Responsible | Accountable | Consulted | Informed |
| RDS | P1 | DBA team | Service ops | Infrastructure | Application |
| … | … | … | … | … | … |
| ELB | P1 | Infrastructure | Service ops | Application | Management |
| … | … | … | … | … | … |
Stage Three: Select a Solution That Fits Your Needs – and Use it
1. Start Simple with Amazon CloudWatch
You can use CloudWatch metrics to monitor almost any AWS resource. CloudWatch comes with a number of pre-built counters like CPUUtilization, DiskQueueLength, etc. You can also receive extra counters from some services like EC2 or RDS by enabling their CloudWatch integration. You can create meaningful dashboards from these standard and extra counters. Moreso, CloudWatch alerts can help notify you about incidents. We recommend making CloudWatch a part of your AWS monitoring regimen.
Here is a subset of CloudWatch metrics to consider:
| Service | Metric name | Why it’s important |
| EC2 | CPUUtilization | % CPU usage by the EC2 instance |
| ALB/ELB | ActiveConnectionCount | Number of active connections to the load balancer |
| HTTPCode_ELB_4XX_Count | Number of 4XX errors generated from the ELB | |
| HealthyHostCount | Number of healthy back-end hosts | |
| TargetResponseTime | Response time in seconds from the backend server to the load balancer | |
| Lambda | Error | Number of time a function errors |
| Duration | Time taken to execute a function | |
| RDS | DatabaseConnections | Number of DB connections to the instance |
| DiskQueueDepth | Number of IO requests waiting | |
| S3 | NumberOfObjects | Number of objects in a bucket |
2. Use Best-of-Breed Tools
Not every monitoring solution for AWS can cater to every resource type. Some are better for monitoring network traffic and some are good for infrastructure, while others can be a natural fit for databases. As a result, you may soon find some parts of your AWS landscape are monitored less than the others. To help avoid this scenario, here are a few options:
Use a Suite of Tools
You can use a mix of monitoring tools. Check with the vendor to see if they have a suite of tools to cover everything. For example, if you are using the SolarWinds® Network Performance Monitor, you may want to use SolarWinds Server & Application Monitor.
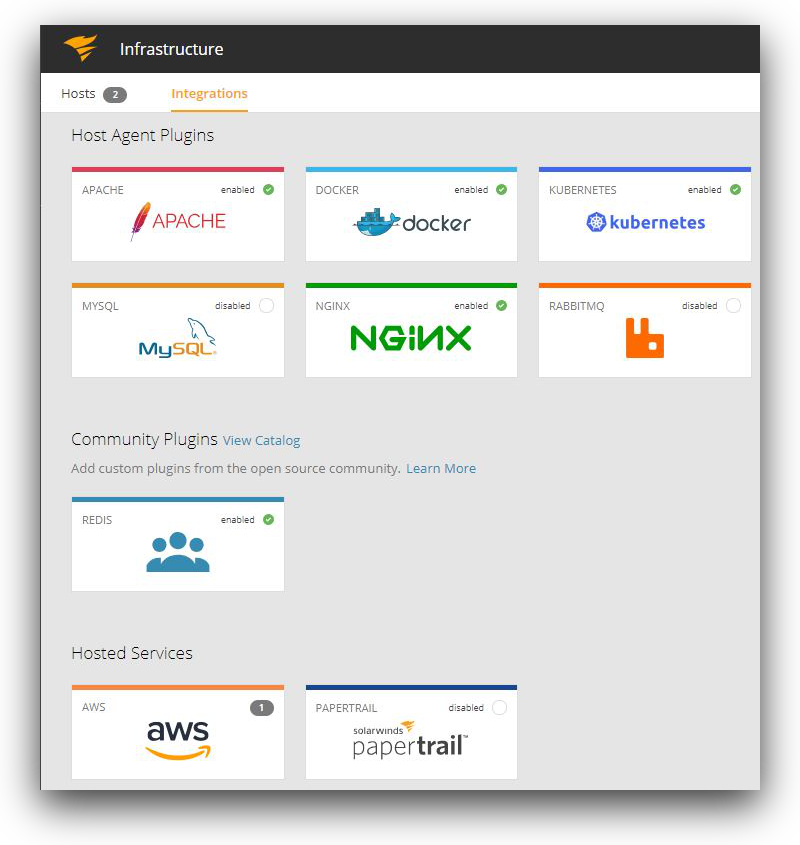
Extend Existing Tools
You can extend a monitoring tool by installing plugins, agents, macros, APIs, or by enabling their AWS integrations. For example, the AppOptics™ application monitoring platform is designed to allow you to extend its capability through custom metrics and integrations. The image below shows only some of the options from its 150+ integrations and plugins available:
Use an APM Tool
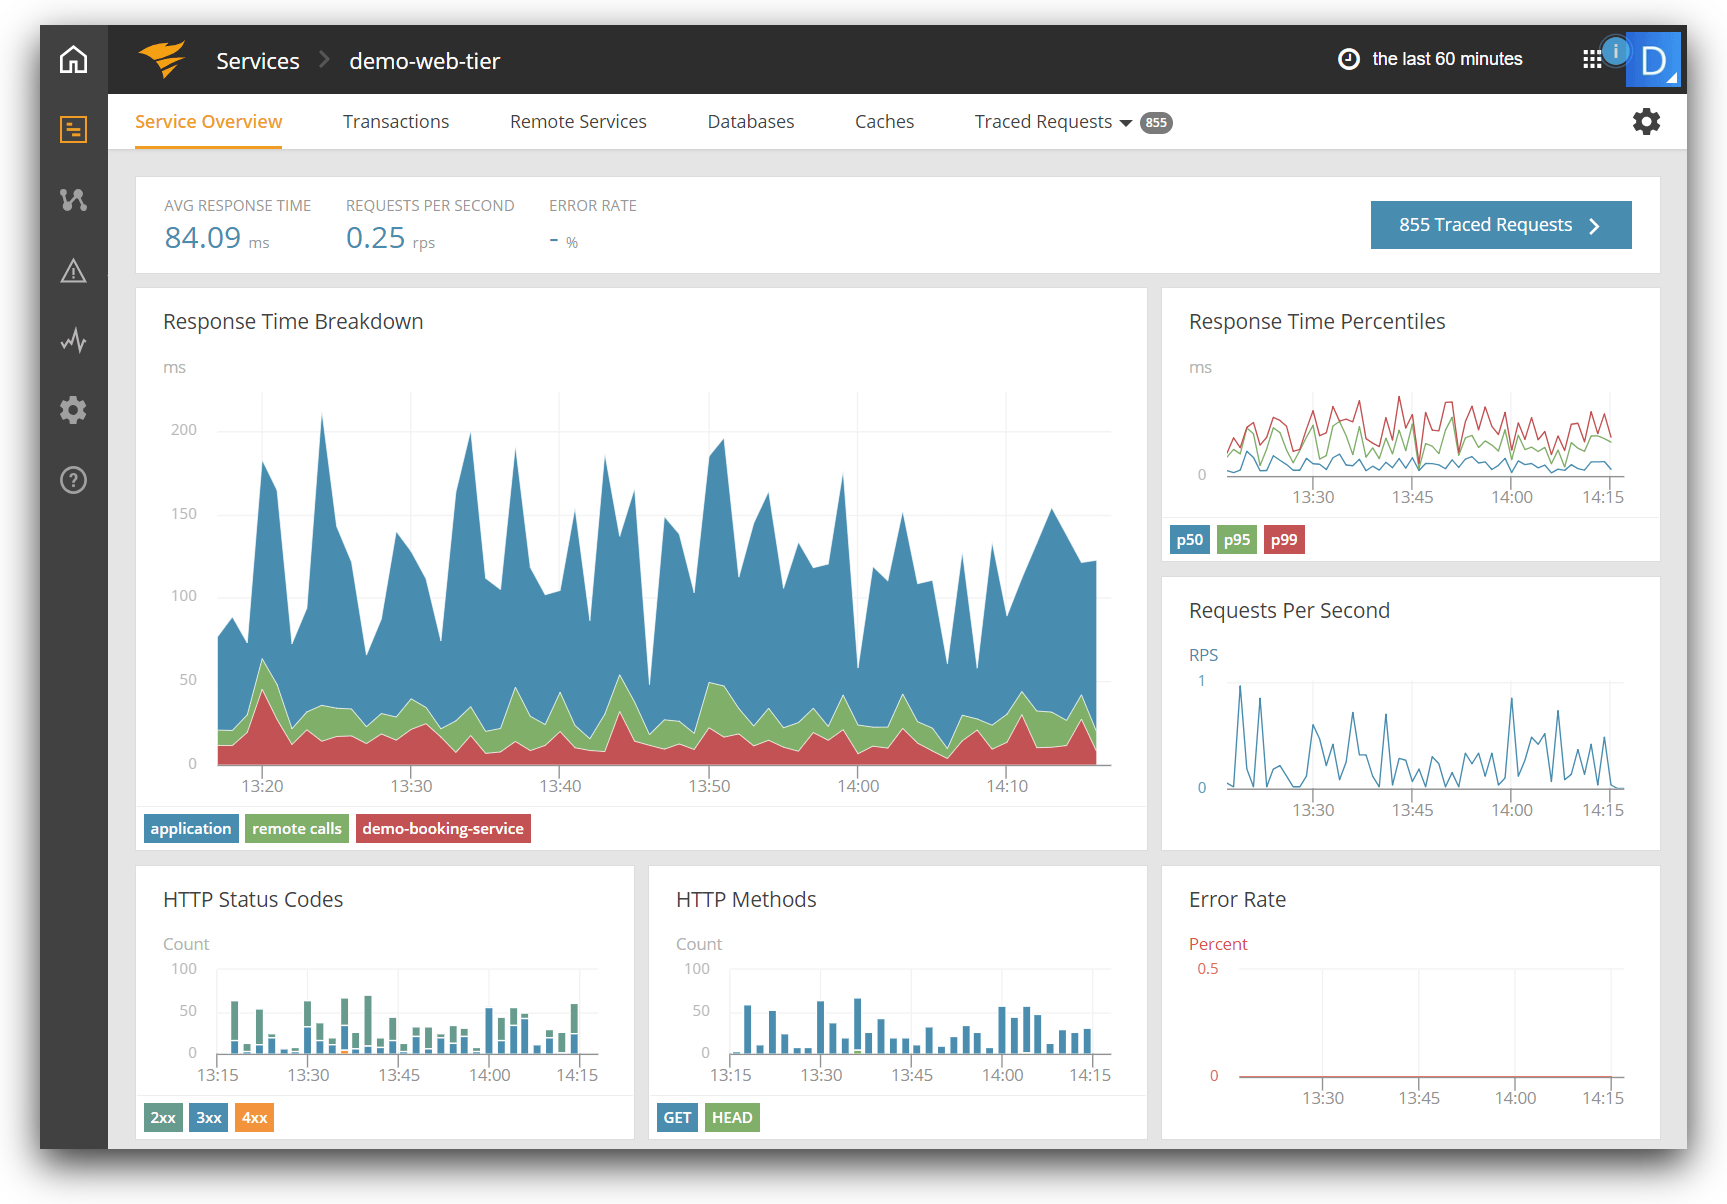
You can invest in an Application Performance Monitoring (APM) tool like SolarWinds AppOptics. As we saw, it is built with a wide variety of integrations available. AppOptics is designed to offer you other benefits such as:
- It presents a unified view of your application from code to infrastructure.
- Distributed tracing can show API calls from source to destination, spanning the entire stack, even across geographical boundaries.
- It can trace applications written in most popular languages and frameworks including Java, Go, Python, .NET Node.js, etc.
- Host monitoring can be done as part of the entire APM suite or on a stand-alone basis.
- CloudWatch monitoring integration can show performance counters from any AWS service.
- It comes with pre-built dashboards.
- It can collect and use custom metrics sent by third-party open source agents or API calls.
- It can create custom metrics from existing ones.
3. Capture Logs
Logs are valuable for troubleshooting performance issues or monitoring compliance. For example:
- VPC flow logs, web server logs, and firewall logs can identify access patterns and attacks.
- Database logs can identify slow-running queries.
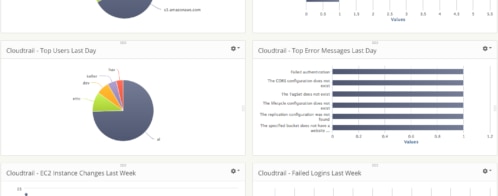
- AWS CloudTrail can identify API calls made to AWS.
- Elastic Load Balancing and host logs can show changes in availability and latency.
- Application logs can show application failures.
- OS logs can show host failure reasons.
Most monitoring systems predominantly gather metrics, and some can capture and display logs in limited capacity. We recommend capturing both metrics and logs from AWS.
Although you can save to CloudWatch logs, we recommend using SaaS solutions because they have better searching capabilities.
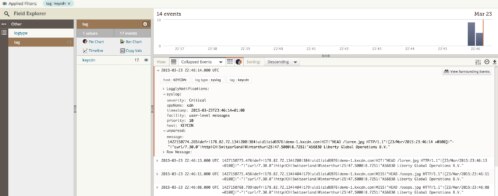
One such log management tool is SolarWinds Loggly®. It’s designed to make it pretty simple to integrate on-premise and AWS-hosted resources with Loggly, including S3, CloudWatch, CloudTrail, and more. The following image shows entries from a MySQL general log in Loggly:
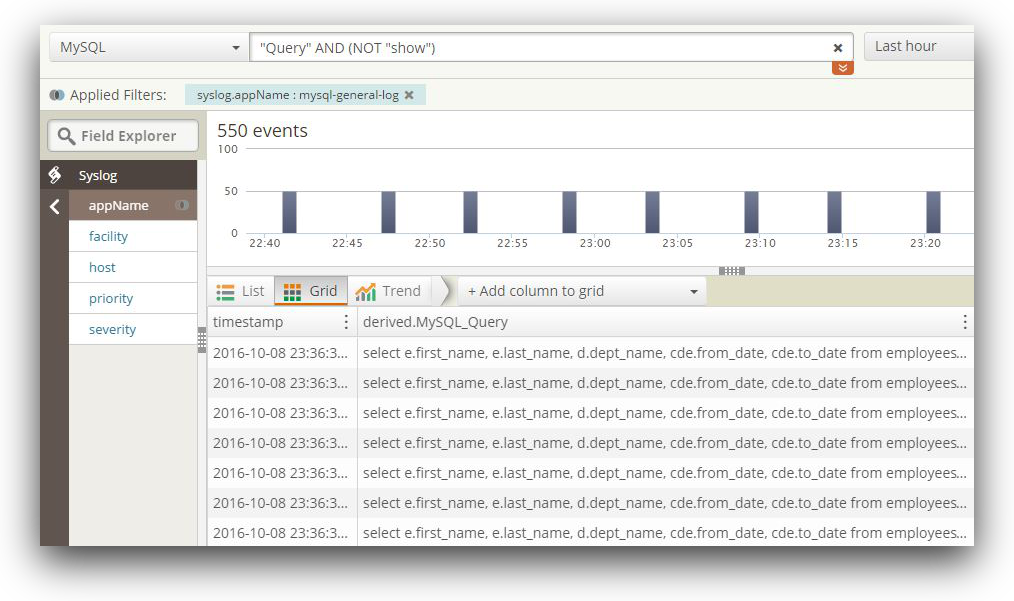
Loggly offers number of features:
- It has a powerful search and drill-down facility with Dynamic Field Explorer (DFE). DFE can allow users to start with a basic search, then narrow down from log event fields parsed and presented in a hierarchical fashion.
- The derived fields feature can help you tcreate custom parsing rules for log events.
- Anomaly detection can help pinpoint abnormal trends in log events.
- It can search only subsets of log data from certain hosts, applications, or sources by creating source groups.
- It can show multiple log files in real time with the Live Tail feature, much like the tail-f command.
- Save your searches and use them again.
- Charts and dashboards can be created from saved searches. There are pre-configured dashboards for popular platforms like Docker, IIS, MongoDB, or CloudWatch metrics.
4. Automate the Monitoring
Make sure you are using as much automation as possible. You can use two types of automation. The first type involves deploying the monitoring agents. For example, using SOE builds, a monitoring tool’s client agent can be installed in any new EC2 instance. Once a host is online, it can run a Puppet module or an Ansible playbook to configure the agent with a pre-defined template. This way, as soon as the host is available, it registers itself with the central server.
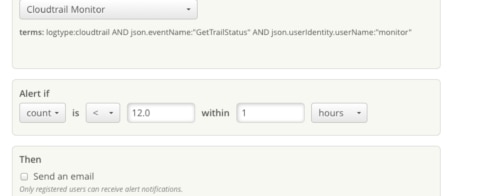
The second type of automation involves alert events. An event trigger should send messages to channels like email, SNS, PagerDuty, or Slack. But it’s best if the trigger can automatically log a ticket in a service management tool like Jira or ServiceNow.
Stage Four: Continued AWS Monitoring Wins and Value Delivered Through Iteration
1. Bake monitoring into the operational readiness protocol
Make sure monitoring is part of the operational readiness checklist for your AWS applications. There should be a process to ensure all components of a new system are brought under a monitoring regimen before it goes to production.
This is especially important for deployments that make changes to the application code or infrastructure. The AWS monitoring solution should be able to give a “before” and “after” picture of the application’s functionality and performance. For example:
- Is the API call taking more time after the new version of a microservice has been deployed?
- Is the application queue length shorter after the EC2 fleet was upgraded to a new class?
If the picture after a deployment is worse, you’ll know it’s likely related to the recent change. You can identify and troubleshoot the issue before promoting it to production. If it’s in production, you’ll have better data to identify what happened and roll back if needed.
2. Test Early, Test Thoroughly, and Test Often
Do a thorough testing once you have rolled out a new monitoring solution for AWS or inherited an old one. For example:
- Are all the components of an app being monitored? These can be:
- API endpoints and URLs
- ELB and ALB DNS entries
- EC2 instances and their log files
- EFS volumes
- RDS databases
- DynamoDB tables
- Lambda functions
- For multi-AZ clusters, are nodes from both AZs included?
- How far back can you go with the metrics and logs? If it’s supposed to keep two weeks’ worth of data, can you go back two weeks for all the components, or are there visible gaps?
- Are all the dashboards working? Are there too many dashboards?
- Are all the alerts working? Are they uniform for all resources of the same type?
- Are you receiving notifications when the alerts are triggered?
- Are log files going to the correct S3 bucket?
- Does the bucket have proper policies attached?
- Is the bucket inadvertently exposed to the internet?
- If the logs contain sensitive data, are they being encrypted or redacted?
- If you are using a solution like SolarWinds Loggly, can you view the logs from the UI and search them?
Advanced organizations like Netflix may also use chaos engineering techniques to purposefully shut down or remove parts of the infrastructure to verify that the monitoring and failover systems respond appropriately.
Conclusion
Choosing the right monitoring tool for AWS is only half the problem. You also need to tailor it for your use case and follow best practices. Implementing AWS monitoring best practices is an iterative process that can take a long time.
Sign up for a free trial of AppOptics or Loggly to get a head start on implementing your monitoring solution. Integration is easy, it typically only takes a few minutes. These tools can help you meet best practices out of the box and can save you time when troubleshooting problems.
The SolarWinds and SolarWinds Cloud trademarks, service marks, and logos are the exclusive property of SolarWinds Worldwide, LLC or its affiliates. All other trademarks are the property of their respective owners.
The Loggly and SolarWinds trademarks, service marks, and logos are the exclusive property of SolarWinds Worldwide, LLC or its affiliates. All other trademarks are the property of their respective owners.

Sadequl Hussain