Holiday Fun: Debugging a Home Network with Loggly
After a recent rainstorm with accompanying 40+mph wind gusts, I was having intermittent Internet connectivity problems. There were days went connectivity would drop for 20-30 seconds dozens of times. Then there would be stretches of perfectly solid connectivity. After turning off some extra devices and access points to simplify the LAN, there was some improvement, but it wasn’t perfect. It was time to start getting serious about debugging the issue, and the Christmas holiday provided the time necessary to put things in place. I had hoped for more time away from my day job running technical operations at Loggly, but luckily I had the skills and the log management service to get the debugging done quickly.
Looking at the logs on the home router, I quickly discovered that it had been rebooting itself. How often was impossible to tell, since the old logs were wiped at each reboot. I needed to get the logs from this router and a few other devices in one place so I could nail down what was going wrong. This necessitated configuring the only spare machine I had lying around; an old Aluminum MacBook Pro with OS X 10.4 installed.
The setup was fairly trivial, following the basic ideas from a MacWorld OS X Hints article. Once configured, the router setup was updated to pass syslog events to the MacBook. But I didn’t want to just sit there with the logs streaming waiting for something to break. Being able create a simple visual to look at the state of my network would also make quick work of narrowing down which logs to examine. Thankfully, I could pass my events to Loggly and they would provide the tools to visualize and correlate issues.
The version of syslog available on the old MacBook did not allow for altering the log headers as necessary to pass on them onto Loggly. I was going to need to have a script to watch the syslog file on the MacBook and pass the events to Loggly. With that in mind, I added some functionality to reformat the events into JSON to simplify parsing. The resulting script below tails a syslog file, reformats the log lines at JSON, then sends the events to Loggly over HTTP/S.
The above would now catch when my router rebooted and any other noteworthy events, but wouldn’t necessarily identify my problem. Unfortunately, recent updates to the Apple Airport Utility software have made it impossible to get Airport access points to send syslog events to a server. I needed another method to probe those devices. I wrote another small script to ping each device on the network I cared about. The results of the ping would then get massaged into a JSON message and sent to Loggly. The script would check each internal access point, the internal and external interface of the router, the first hop from my house onto the Internet, and finally an additional Internet destination.
With the data now flowing into my Loggly account, everything I needed to debug my issues were all in one place. I created dashboard widgets to be able to see when any element of my network was down, along with the ping response times from the network checks. The visual elements allowed me to quickly see when something broken or if I was just experiencing a network slowdown.

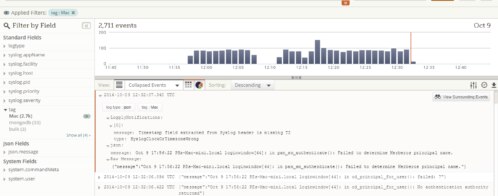
From the visual view, I could quickly click on an event and see the precise logs from that time period. Then it was a trivial matter of looking at a few log lines from my various sources to find the culprit. In the case above, I could see in the logs that one of my internal WiFi access points was flapping. It kept losing radio sync with the main AP and would drop off the wireless network.

In the end, I found multiple points of failure in my network. The router from AT&T was flaking out, the U-Verse link was losing sync, and an access point on my internal network was flapping. A couple of days with some AT&T techs on-site to replace the router and the fibre from the pole to the house remedied the first two problems. And the problem access point has been turned off until I can make an Ethernet run from it to the router instead of letting the device expand the WiFi network. If I hadn’t been able to put all my logs in one place and easily created visualizations of the data, I would most likely still be trying to figure out what was going wrong.
Postscript: Telling AT&T customer support that, “the logs from the router indicate it is rebooting itself,” instantly gets your problem escalated within the support chain and a Tech at your house a few hours later on a Sunday. 🙂
The Loggly and SolarWinds trademarks, service marks, and logos are the exclusive property of SolarWinds Worldwide, LLC or its affiliates. All other trademarks are the property of their respective owners.

Hoover J. Beaver