How to monitor Elasticsearch performance like a pro: Logfooding, part 1
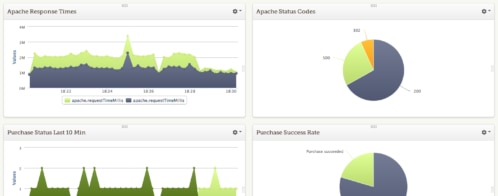
At Loggly, we use our own product for a variety of different Elasticsearch monitoring and analysis tasks. This gives us immediate, detailed feedback on how well our log management solution works in solving the problems our customers face. In a very real sense, we are just like our customers: we’re all deploying complex, fluid systems, where change is the only constant. Dogfooding, or logfooding, as we like to call it, also lets us constantly improve parts of the system that are hidden from the user but that make our product fast and reliable, such as our Elasticsearch clusters.
In this three-part series, I’ll be breaking down how we use our own product to help improve it. I’ll also explain how and why we’ve made the decisions we have along the way.
I’ll cover:
- Collecting the data—without data, there is nothing to see
- Structuring the data to make complex data easy to understand
- Monitoring and using the Elasticsearch data in Loggly, since a good tool turns good data into insights and actions
Problem: Elasticsearch cluster hotspots
Let’s start with a high-level problem: Elasticsearch clusters are capable of indexing massive amounts of data, but only if that data is spread evenly across all active shards in the system. If we try and index too much data into a single shard, or a single index, or a single node, it becomes a hotspot. The net effect: our overall indexing performance is gated by that single shard/index.
So, how do we identify and understand hotspot issues?
In our system, we have multiple writers (aka indexers) handling completely separate streams of data, so the impact of a hotspot is limited to a portion of the total data. But even so, we do see occasional hotspot-related slowdowns of our indexing, and we really don’t like them.
So, the first question to answer is: What data is available to help us identify this problem?
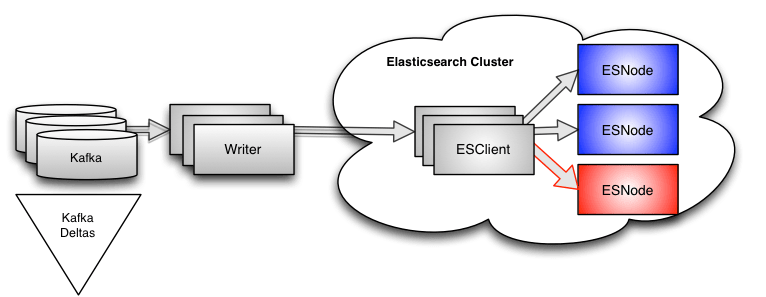
Looking at Kafka deltas
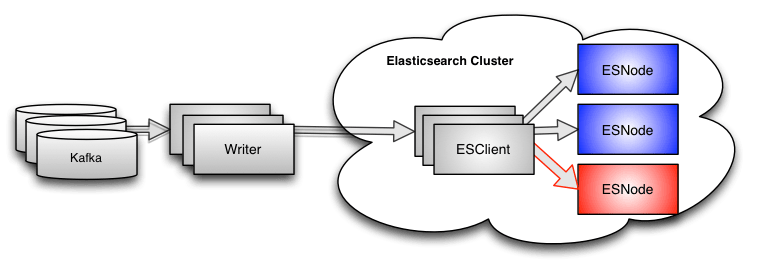
All of the data flowing through our system lives in Apache Kafka. We monitor every topic and every partition within each topic, and we log that data every couple of minutes. When we have an indexing hotspot, we see the deltas start to rise on the topics being consumed by our writers. This makes sense because the writers will only be reading from Kafka as fast as they are writing to Elasticsearch.
The downside of this data is that it is very, very high level. Yes, we can see when our writers slow down. We can deduce from the topic(s) which writer(s)–and therefore customer(s)–are affected. But that is about all we can say.
If it sounds like our Kafka monitoring is no use to us, then consider this:
- It does tell us that there is an issue,
- It tells us fairly quickly, and
- It provides a high-level measure of the impact of the problem.
We monitor our Kafka offsets continuously, and this gives us a high-level view (and understanding) of what the system is capable of. Knowing this lets us stay ahead of the curve when it comes to growing our clusters.
Lesson: Collect both high-level and low-level data
More generally, if you don’t have a way to measure the gross performance of your system, you’re going to have a really hard time figuring out which of the (many) lower-level parts of your system you should be focused on. You could, in fact, be completely missing a problem simply because you’re not monitoring at a high enough level. You could spend your life fixing problems in the part of the system that is heavily instrumented, while the rest of the system is going up in flames.
The other important value in our Kafka delta data is that it can be used as a simple on/off switch for alerting: If the deltas grow too high, your on-call team can be swung into action. Once the deltas drop back into the acceptable range, they can move on to other things. Many engineers love to dive into the details, but most on-call teams want to identify and resolve problems as quickly as possible. Never underestimate the value of a simple, easy-to-understand trigger for action.
Writer instrumentation
Let’s go one level deeper into the problem. We can see, thanks to our Kafka monitoring, that something is wrong with the writers, so what data do we need from them?
We have instrumented our writers to tell us how fast they are reading from Kafka and pushing data into the indices, both in aggregate and for each customer, every 10 seconds. This instrumentation is done using time-windowed counters for the number of events and bytes we’re indexing—almost anyone could implement it in a relatively short time. This type of data is easy to get, and incredibly useful because it gives us the next level of detail.

Sadly, even this data is not detailed enough to solve our problem. Yes, we can see when a writer slows down, and we know exactly which customers are affected, and the time window is 10 seconds instead of two minutes. However, because we use bulk requests that write to many indices simultaneously, the only data we get back from Elasticsearch is the total time for the bulk request. There is no indication that a specific index is the root cause of the problem. In the past, we considered extending the instrumentation to count by index, but (as you will see) there was a better, simpler approach.
Just as with the Kafka data, the writer data does give us valuable information that is not available elsewhere. If the Kafka monitoring gives us the 50,000-foot view of what is going on in our system, the writer gives us the 5,000-foot view. Still too high to really make out the details but low enough to let us know where to focus next.
Side note: You might be wondering why we monitor both Kafka and the writers. It seems like they are both measuring very similar things. In practice, we rarely use the Kafka monitoring for anything other than alerting on major events. We use the writer data as input to our pipeline governors, and can dynamically reprioritize an individual customer based on its current load. This means that we can keep our pipeline running at optimal performance without any manual intervention. When you’re dealing with thousands of customers, any number of which may be bursting at 10x or 100x their normal rate, being able to maintain the same performance for all other customers is incredibly important. The writers are the best place to measure this.
Elasticsearch cat data
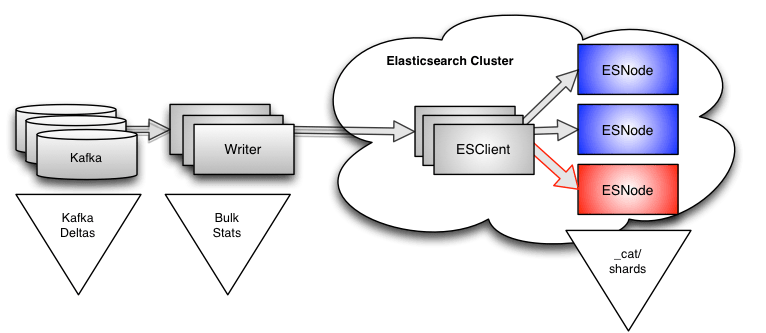
One of the beauties of Elasticsearch is that it provides a very rich API, which can give you a lot of information about what is happening deep inside the cluster. It can be quite overwhelming to try and wrap your head around everything in the API, but for our purposes, there is an endpoint that gives us all of the information we need to solve our problem. That endpoint is:
GET _cat/shards
The documentation doesn’t make it obvious, but if you dig a little you will find that there are almost 60 different data values available for every shard in the cluster. The two we care about are:
indexing.index_totalindexing.index_time
The first of these is a counter that tells us how many documents (events) have been added to the shard over its lifetime. The second tells us how many milliseconds of CPU time was spent adding those events.
Right now, you’re probably thinking…
“Aha! We can just use index.total to figure this out! If we can find the shard that has the fastest increase in index.total, we’ve found our hotspot!”
The wrinkle for us is that our customers send us log events that range in size from a few hundred bytes up to a megabyte. Simply knowing how many events we’re adding to the shard is not enough, because the indexing load of adding 1,000 1k events is roughly the same as adding a single 1MB event. Thus, for us, the index.time value is actually the more useful value. Unfortunately, it isn’t obviously related to the other measures we’ve been talking about, which have all been event counts and bytes. Because of the heavy multi-threading that happens inside Lucene, you can also end up with changes in index.time that are greater than elapsed time between the measurements, which can be a little disconcerting the first time you see them.
In any case, we’ve now identified the values we care about from inside Elasticsearch, and need to gather them on an ongoing basis. For us, that means we make the _cat/shards call every few minutes, compute the difference in these values, and then compute the rate of change.
For example, if we gather this data:
indexing.index_total=30000andindexing.index_time=15000
then
indexing.index_total=40000andindexing.index_time=20000
We can compute an index.total delta of 10000 and an index.time delta of 5000. If we gathered these one minute apart, we get a rate of change of 167 events/second for index.total and 83 ms/second for index.time.
We gather this data using a cron job that runs every 15 minutes, using a simple, robust mechanism. Since the response from Elasticsearch is plain text, we simply make the request and save the response in a text file. On each cycle, we look for an earlier set of data, compute the deltas, and compute the rates from those deltas. If we happen to miss a cycle, we will reuse whatever older data is available, and can still be relatively sure that the rate values are sensible. Sometimes the simplest approach is the best: Even the fact that we “missed a cycle” can be used to detect issues with a cluster.
When a new shard is added to the system, we just treat it as if it was created at the time of the previous data and compute its rate of change based on that. This gives us rates of change that are lower than reality for brand-new shards, but from the second cycle on, the rates of change are accurate. Again, it is a simple approach, but has yet to cause us problems.
Summary
In trying to solve our problem of identifying indexing hotspots, we’ve identified the following useful data:
- Kafka deltas for the indexing queues: Provide a very high-level view to detect significant issues. Used to swing our on-call team into action.
- Writer instrumentation (events/bytes per second being written to Elasticsearch): Provides a mid-level view for better granularity. Used to drive action in our data ingestion service governors.
- Elasticsearch _cat data (events per second added to each shard and CPU time to add those events): Exactly the data we need to know what’s happening with our clusters.
In the next post in this series, I’ll explain how we take all of this data and structure it to get the most out of it.
Let’s recap a few major takeaways:
- Don’t ignore high-level data.
- The Kafka deltas, for example, don’t directly address the problem of hotspots in the Elasticsearch cluster but are useful to see what is happening across the entire system, and in firing up the on-call team when there is a major issue.
- Think about the best place to get the data.
- We could have added more instrumentation to the writers to tell us which index was being written to the most, but even this would have been at best an approximation of the data we can get directly from Elasticsearch. In any reasonably mature system, you will probably find that there are already APIs available to give you useful information, with little effort on your part.
- Think about what other information is available.
- We’ve been focused on a specific problem (hotspots), but the
_cat/shardsdata is far richer than the two fields we’ve cherry-picked here. Similarly, the instrumentation in the writer provides more information than we’ve discussed here. Collecting this data before you know you need it is often better than not having it when you do, and since you’re probably going to have to do something to get only what you need, doing a tiny bit more to get more seems like a reasonable tradeoff.
- We’ve been focused on a specific problem (hotspots), but the
The Loggly and SolarWinds trademarks, service marks, and logos are the exclusive property of SolarWinds Worldwide, LLC or its affiliates. All other trademarks are the property of their respective owners.

Jon Gifford