Introducing: Eight Additional Preconfigured Dashboards

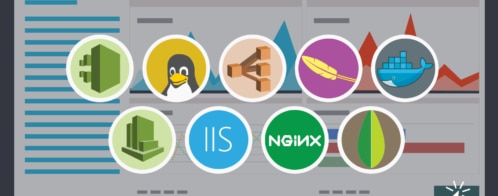
If you’ve been using SolarWinds® Loggly®, you may remember the nine pre-configured dashboards we released in June last year. These dashboards were created by the Loggly team and covered popular technologies like Apache, Amazon CloudWatch Metrics, Amazon CloudTrail, Amazon ELB, Docker, IIS, MongoDB, Linux, and Nginx. These dashboards pull together the common metrics you might want to monitor and offered a quick start for monitoring
We had a great deal of feedback from users on how useful these dashboards and metrics are, and numerous requests for more preconfigured dashboards. So here they are!
Eight New Preconfigured Dashboards
We are happy to announce eight additional preconfigured dashboards that cover:
● Java
● Heroku
● PHP
● Windows
● Python
● HAProxy
● Node.js
● Rails
These new dashboards provide immediate, impactful views of performance and usage of your various systems without needing any configuration or setup. They also feature our beautiful chart styles and integrate with our chart time-sync capability.
Preconfigured dashboards are available to customers of our Enterprise, Pro, and Standard tiers, as well as users in a trial of the product.
How to Add Your First Preconfigured Dashboard
Inside Loggly, select the “Dashboard” tab in the top nav, and you’ll see a new link in the top right of the Dashboard page, titled “Preconfigured Dashboards.”
Select your technology from the list of options. Click the “Add dashboard” button underneath the image, and watch your monitoring and get an instant jump-start.
Here’s an animation walking through the process in under 30 seconds:
Still Want More Dashboards for Other Sources?
On the preconfigured dashboards page, you’ll see a link in the top right to give feedback. That’ll open a note directly to our product team. We’re eager to know what you think of the preconfigured dashboards, and which technologies and log sources you’d like to see next. Let us know!
Loggly + Preconfigured Dashboards = Log Analysis and Log Monitoring Made Easy
We think you’ll love the new dashboards, so log in to your account today and check them out.
Not a SolarWinds Loggly user yet? Take the 14-day free trial of our and solution—no credit card required.
Thanks, and happy logging!
The Loggly and SolarWinds trademarks, service marks, and logos are the exclusive property of SolarWinds Worldwide, LLC or its affiliates. All other trademarks are the property of their respective owners.

Loggly Team