Log Management in Hosted Platforms Like DigitalOcean
With DigitalOcean Monitoring, you can collect metrics for visibility, monitor Droplet performance, and receive alerts when problems arise in your infrastructure. Many users often want to extend this infrastructure monitoring with application-level monitoring.
This means debugging issues requires expertise, familiarity with your product and infrastructure, and often the involvement of many people in various fields—all to chase down a single problem.
SolarWinds® Loggly® makes this easier by giving you the ability to centralize your application logs, system logs, and other seemingly unrelated services into one easy-to-digest, holistic view.
What Is Loggly?
Loggly is a cloud-based log aggregation and analytics platform. It’s a perfect match for hosted platforms like DigitalOcean because it not only provides a plethora of plugins to aggregate logs from various platforms, but also supports the widely used logging agent “rsyslog” to automatically configure your service to send logs as needed.
Using these features, an admin can easily send system and application logging into one place to review, investigate, and ultimately quickly debug issues.
The Manual Process
To understand the benefit of an aggregated log platform, it’s first necessary to understand how difficult it can be to debug an application issue manually without a tool like Loggly. On its own, DigitalOcean provides visibility into some metrics and Droplet performance, but its capabilities when it comes to application level monitoring and logging are limited. There’s no full-stack logging solution provided out of the box, leaving you to manually assemble the pieces when something breaks and you must troubleshoot.
Let’s look at how difficult it is to debug manually, then how Loggly makes it easier.
For our example, we’ve created an artificial scenario where an nginx application deployed on DigitalOcean continually crashes, causing our load balancer service to show a “503 Service Unavailable” error. To investigate this by hand and CLI, we first need to start at a console.
Here are the first questions to answer:
- Is the service running?
- Is the port listening?
- Are there any errors on the application?
Let’s check some logs to see what we can find out.
root@loggly1:~# systemctl status nginx | grep Active
   Active: active (running) since Mon 2020-09-21 22:51:59 UTC; 48min ago
root@loggly1:~# netstat -apn | grep LIST | grep 80
tcp        0      0 0.0.0.0:80              0.0.0.0:*               LISTEN      3995/nginx: master
tcp6       0      0 :::80                   :::*                    LISTEN      3995/nginx: master
root@loggly1:~# tail -n 5 /var/log/nginx/access.log
10.120.0.6 - - [21/Sep/2020:23:41:38 +0000] "GET / HTTP/1.0" 200 46096 "-" "-"
10.120.0.6 - - [21/Sep/2020:23:41:48 +0000] "GET / HTTP/1.0" 200 92432 "-" "-"
10.120.0.6 - - [21/Sep/2020:23:41:58 +0000] "GET / HTTP/1.0" 200 106912 "-" "-"
10.120.0.6 - - [21/Sep/2020:23:42:08 +0000] "GET / HTTP/1.0" 200 46096 "-" "-"
10.120.0.6 - - [21/Sep/2020:23:42:18 +0000] "GET / HTTP/1.0" 200 46096 "-" "-"
root@loggly1:~# tail -n 5 /var/log/nginx/error.log
2020/09/21 23:39:42 [alert] 3995#3995: worker process 4304 exited on signal 9
2020/09/21 23:39:43 [alert] 3995#3995: worker process 4305 exited on signal 9
2020/09/21 23:39:43 [alert] 3995#3995: worker process 4306 exited on signal 9
2020/09/21 23:39:44 [alert] 3995#3995: worker process 4307 exited on signal 9
2020/09/21 23:39:44 [alert] 3995#3995: worker process 4311 exited on signal 9
Looks like the application is currently running, and it looks like the ports are bound to a process, but we can see from the nginx error logs there’s clearly something amiss. Why are the worker processes dying?
Perhaps the systemd or kernel logs will provide more detail.
root@loggly1:~# journalctl -u nginx -n5
-- Logs begin at Mon 2020-09-21 21:13:47 UTC, end at Mon 2020-09-21 23:48:42 UTC. --
Sep 21 22:51:59 loggly1 systemd[1]: nginx.service: Succeeded.
Sep 21 22:51:59 loggly1 systemd[1]: Stopped A high performance web server and a reverse proxy server.
Sep 21 22:51:59 loggly1 systemd[1]: Starting A high performance web server and a reverse proxy server...
Sep 21 22:51:59 loggly1 systemd[1]: nginx.service: Failed to parse PID from file /run/nginx.pid: Invalid argument
Sep 21 22:51:59 loggly1 systemd[1]: Started A high performance web server and a reverse proxy server.
Nothing in systemd.
root@loggly1:~# tail -n 5 /var/log/messages
Sep 21 23:51:40 loggly1 kernel: [ 9475.288921] nginx invoked oom-killer: gfp_mask=0x6000c0(GFP_KERNEL), nodemask=(null), order=0, oom_score_adj=0
Sep 21 23:51:40 loggly1 kernel: [ 9475.292625] nginx cpuset=/ mems_allowed=0
Sep 21 23:51:40 loggly1 kernel: [ 9475.294337] CPU: 0 PID: 4362 Comm: nginx Not tainted 4.19.0-10-cloud-amd64 #1 Debian 4.19.132-1
Sep 21 23:51:40 loggly1 kernel: [ 9475.297871] Hardware name: DigitalOcean Droplet, BIOS 20171212 12/12/2017
...
Here it looks like we’ve found our problem: nginx is being OOMKilled. The system has determined it’s not allowed to access more memory and thus killed it to comply with the system mandates.
Looking further into the kernel logs we find the culprit:
Sep 21 23:51:40 loggly1 kernel: [ 9475.377129] Task in /system.slice/nginx.service killed as a result of limit of /system.slice/nginx.service
Sep 21 23:51:40 loggly1 kernel: [ 9475.380985] memory: usage 3172kB, limit 3172kB, failcnt 1387
Why does the nginx service have a limit of only 3172Kb of memory?
root@loggly1:~# cat /lib/systemd/system/nginx.service
...
[Service]
...
KillMode=mixed
MemoryLimit=3.1M
...
Ah, clear as day. The systemd service has an unreasonably small limiter. Let’s increase it and see how our service responds!
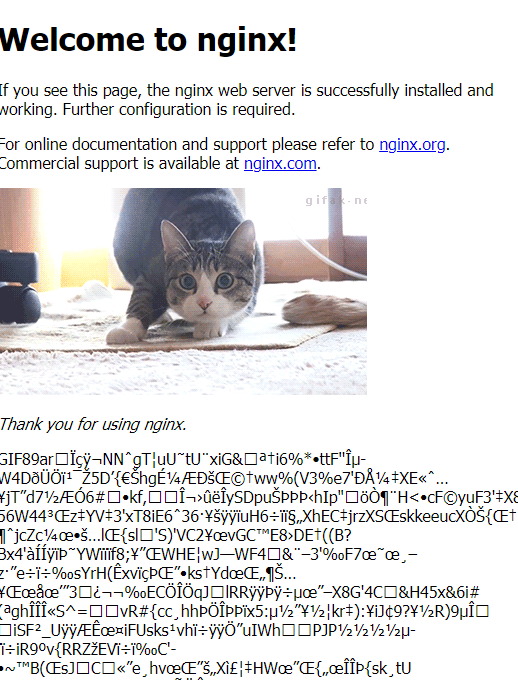
And now we find the true problem. It looks like someone tried to include a great cat meme with an image link (correct) and a binary copy into the index.html file (incorrect). After a quick file tune-up and a follow up with our illustrious development team, we have a serviceable nginx instance.
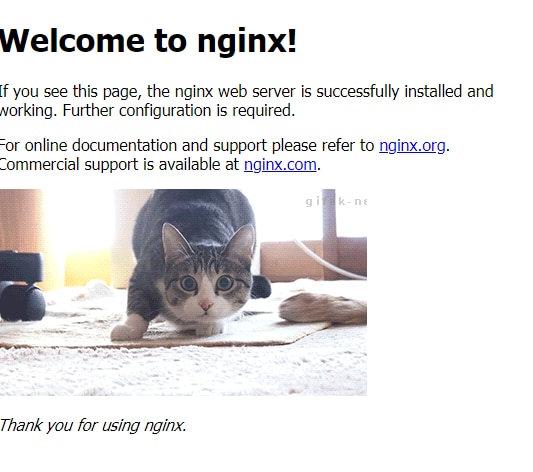
The application now loads properly with no additional errors.
Debugging Is Easier and Faster With Loggly
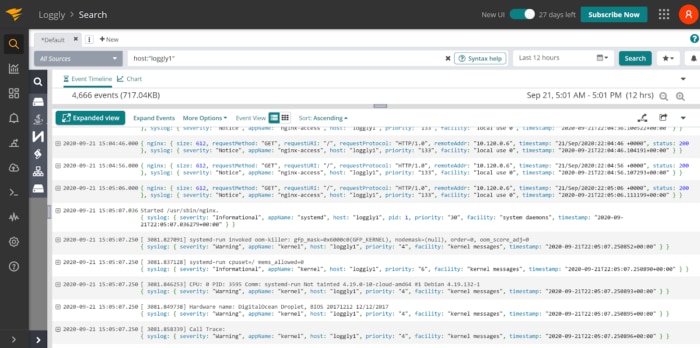
Now let’s look at how we could have done the same investigation with the log aggregation service of SolarWinds Loggly and our rsyslog daemon.
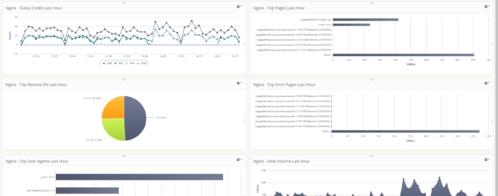
We can start by looking for a logging anomaly:
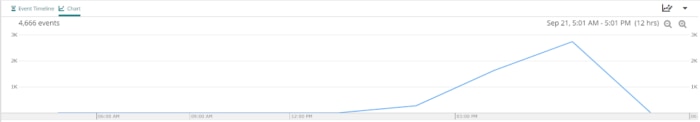
Then by scrolling down to the start of the anomaly, we can find the first appearances of our memory deaths from our systemd logs.
That’s it, we’re done already.
This does involve some prerequisite work to accomplish, however.
To install the configuration updates required and to add the necessary files to our rsyslog watcher, we can use the scripts provided by Loggly:
curl -O https://www-staging.loggly.com/install/configure-linux.sh
sudo bash configure-linux.sh -a SUBDOMAIN -t TOKEN -u USERNAME
curl -O https://www-staging.loggly.com/install/configure-file-monitoring.sh
sudo bash configure-file-monitoring.sh -a SUBDOMAIN -u USERNAME -f FILENAME -l ALIAS
Summary
Manually grepping through application logs and intuiting the right places to look is difficult and cumbersome. This manual approach doesn’t scale well and can be tedious, taking away from real improvement of your product and infrastructure.
SolarWinds Loggly allows you to export your logging data to a centralized, easy-to-use platform. Using their simple configuration scripts and exports helps ensure hosted platforms such as DigitalOcean can ship logs to a holistic, aggregated view.
The Loggly and SolarWinds trademarks, service marks, and logos are the exclusive property of SolarWinds Worldwide, LLC or its affiliates. All other trademarks are the property of their respective owners.

Loggly Team