Logging with Context
Add trace context to your logs
The Problem
When troubleshooting an issue with logs, it’s often fairly easy to find an important log; for example, an exception is logged and an alert is fired. Once you find an exception in the logs, the trickier part can be understanding why the exception was thrown.
One common approach to this problem is looking at the surrounding logs. Logs are typically in chronological order, so if you see an exception, look at the logs’ lines from just before the exception occurred. What’s wrong with this method? You might be looking at completely unrelated logs. In a busy application with thousands of requests per minute, it’s difficult to understand which logs belong to a specific request, and which logs relate to the exception that you’re trying to understand. People have attempted to solve this problem for a long time, logging session IDs, API tokens, and other types of unique identifiers. This solves part of the problem but requires manual work and breaks down once multiple systems and services are involved.
The Solution
What’s better than a solution that only works in certain situations and requires manual work? An integrated solution that works across systems. With the integration of SolarWinds® AppOptics™ and SolarWinds Loggly® you can automate application instrumentation and insert a shared trace ID into the logs.
How Does it Work?
It’s simple. AppOptics libraries use auto-instrumentation and context propagation through HTTP headers which are passed through to the logs.
OK, maybe it’s not that simple—let’s look at an example. In this example, we have a node service that makes an HTTP call to a PHP service, and that PHP is supposed to add a user to a database. Something goes wrong in this example, and an exception is thrown by the PHP service.

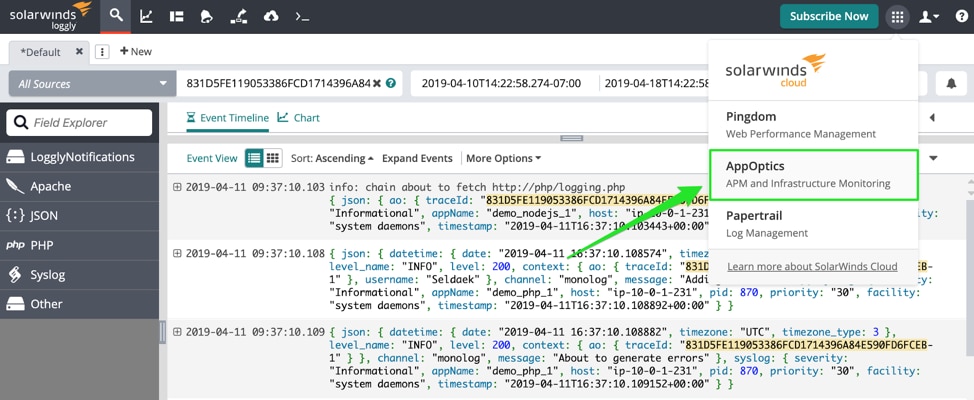
Normally when you are troubleshooting an issue like this, the exception may be all you have to work with, and you are forced to guess which log messages came before it. When we use the AppOptics APM libraries, the trace ID is added to each log message, even across the node app to the PHP app. Now, we can simply use the trace ID to find all logs associated with this request as seen below.

What a difference! Instead of one log line and some guesswork, we can see all logs for this request as it traverses through multiple services. The uncaught exception didn’t appear out of nowhere. We can see which user we were trying to add, as well as multiple warnings about missing data before we reached the exception.
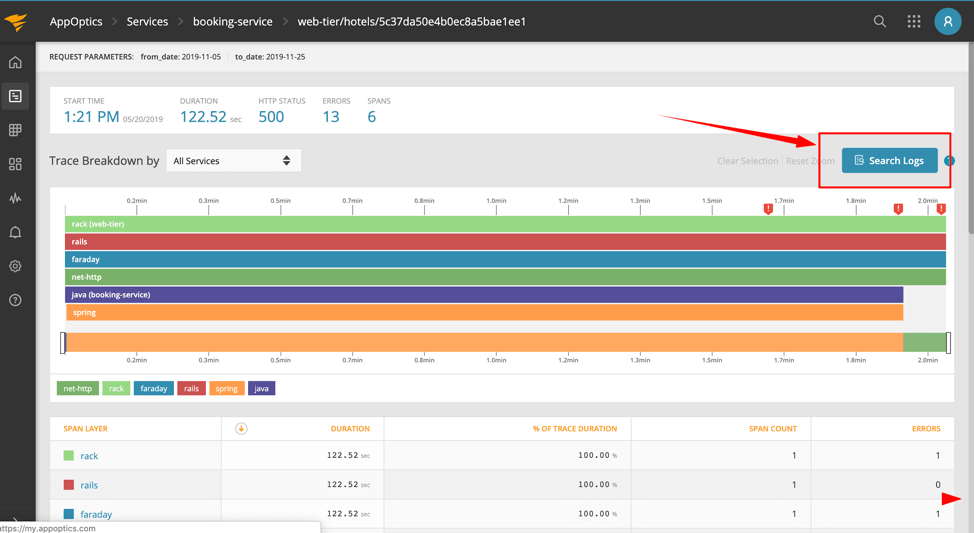
Logs + Traces
In this example, we focused on adding trace context to the logs to make your life easier when troubleshooting application issues. You can reduce your troubleshooting time even more by using AppOptics, and easily transition from traces, down to the relevant logs using the same approach.
Start a free trial of AppOptics easily through the menu in the Loggly header.
The Loggly and SolarWinds trademarks, service marks, and logos are the exclusive property of SolarWinds Worldwide, LLC or its affiliates. All other trademarks are the property of their respective owners.

Loggly Team