Log Management and Analytics

Explore the full capabilities of Log Management and Analytics powered by SolarWinds Loggly

View Product Info

FEATURES

Infrastructure Monitoring Powered by SolarWinds AppOptics

Instant visibility into servers, virtual hosts, and containerized environments

View Infrastructure Monitoring Info

Application Performance Monitoring Powered by SolarWinds AppOptics

Comprehensive, full-stack visibility, and troubleshooting

View Application Performance Monitoring Info

Digital Experience Monitoring Powered by SolarWinds Pingdom

Make your websites faster and more reliable with easy-to-use web performance and digital experience monitoring

View Digital Experience Monitoring Info

Blog How-tos

Managing a Meteor Application in Production: Three Real Log Management Use Cases

By Mike Ghobrial 31 Mar 2015

At Salesbox.io, we love Meteor! It is great platform for developing and bringing an application to production.

But one of the challenges of running a Meteor application in production is managing all of the different components that support Meteor. So at Salesbox.io, we use Loggly to help manage our Meteor application in production.

Here are three use cases where Loggly has come in handy for us.

(This post was updated with references to updated Meteor logging methods in July 2017.)

Use Case #1 — Scalable Monitoring of a Meteor Server

Have you used console.log to debug an issue in Meteor? In development, console.log is great for debugging because we can get immediate feedback. But, when you have deployed your application to a remote server, you lose that immediate feedback. And if you are hosting your own deployment, then you have to log into the server and dig through the logs. With multiple servers, it does not get easier.

Wouldn’t it be great if we could use something as simple as console.log after our Meteor application has been deployed?

Turns out, it can be as simple as Logger.log().

Example: Sending a Log From a Meteor Server to Loggly

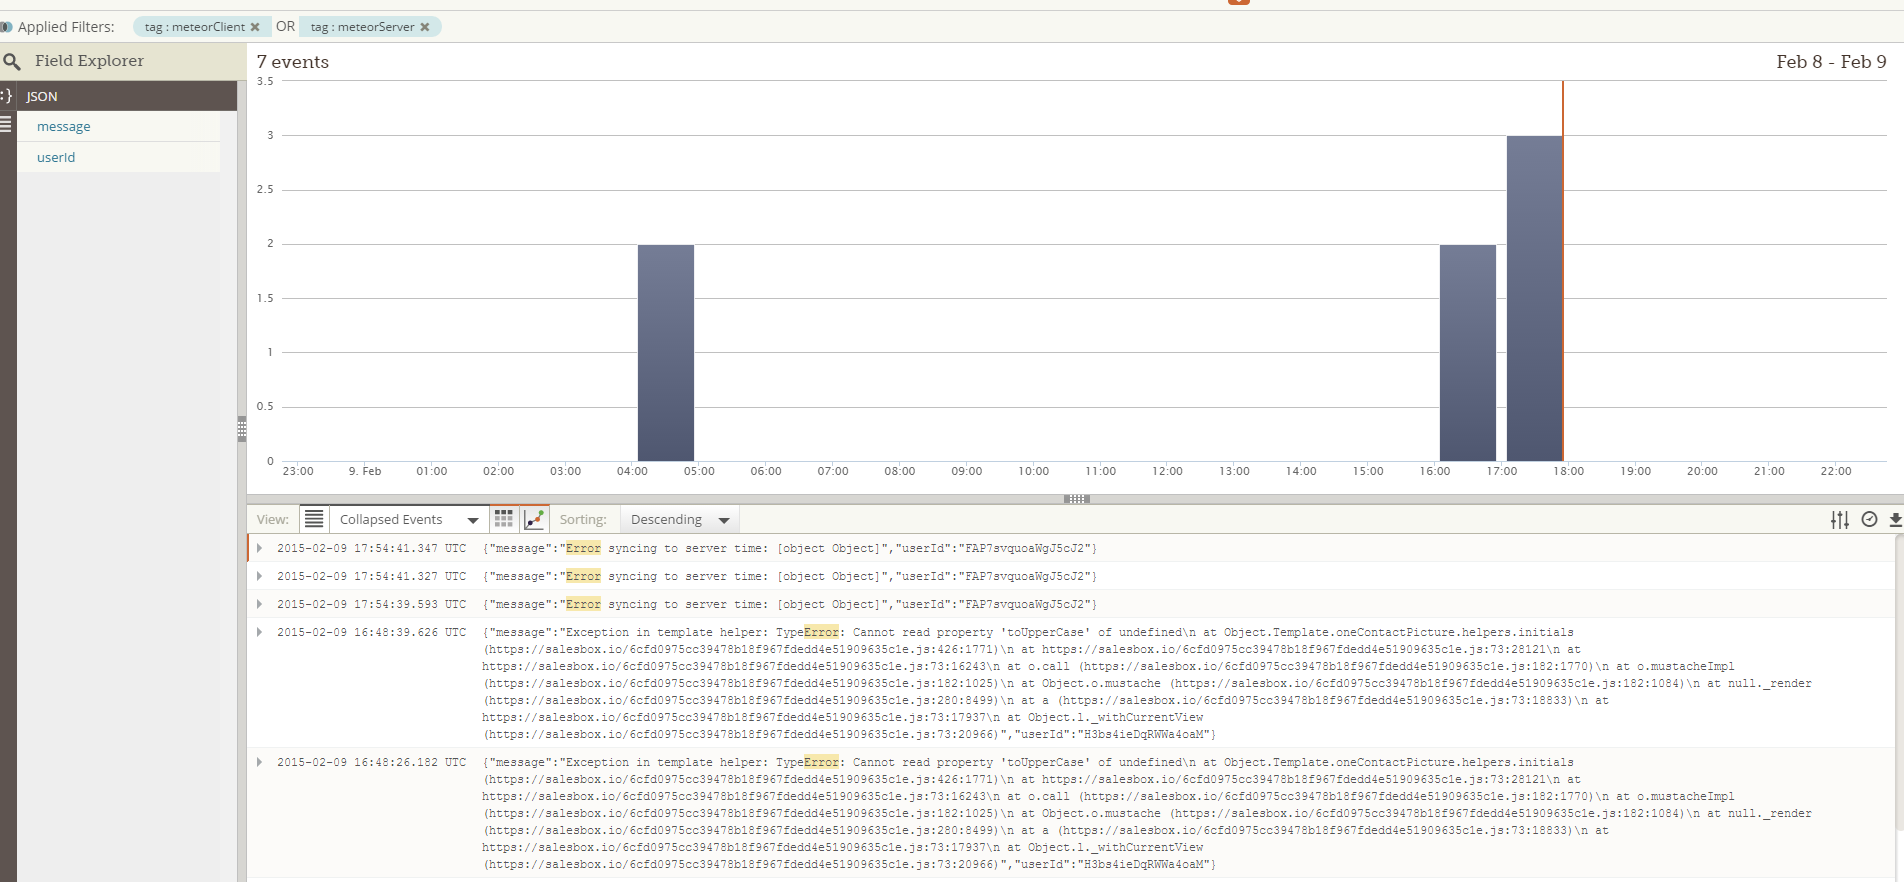
Loggly allows us to transmit a log from any of our Meteor servers to a Loggly server, where it is processed and stored at a central location. We can then use Loggly’s user interface to analyze the logs.

For example, let’s say we would like to know when we are unable to update the “Players” collection in the following code:

Template.adminDashboard.events({
  'click .givePoints': function () {
    Players.update(
      Session.get("currentPlayer"), {$inc: {score: 5}},
      function(error) {
        if (error) {
          Logger.log("we have an error");
        }
    });
  }
});

In that case, all we need to do is place a callback within Players.update. And within the callback, we can send a message (e.g. “we have an error”) to Loggly if an error is found.

We can then log into Loggly and search for “we have an error”, which may give us something like the following:

Meteor Logging usecase1

Since Loggly acts as a central logging location, it will scale as we add servers. That allows us to see error across all the servers. So we can figure out what broke, when it broke, and how we might be able to fix it.

If you want, you could even use a proxy pattern to force calls to console.log to be sent to loggly when your Meteor application is in production.

How to Enabled Server-side Logging for Meteor.

For an update on the state of Meteor logging as of July 2017, you can read the Meteor logging quickstart blog post by Abigail Watson.

Server-side logging in Meteor takes just two steps. First, install the loggly smart package (or get the package source code):

meteor add miktam:loggly

Second, set up the Logger object:

Meteor.startup({
  Logger = new Loggly({
        token: "your-really-long-input-token",
        subdomain: "your-subdomain",
        auth: {
          username: "your-username",
          password: "your-password"
        },
        //
        // Optional: Tag to send with EVERY log message
        //
        tags: ['global-tag'],
        // Optional: logs will be stored in JSON format
        json: true
      });
});

Now server-side logging is enabled and you can use any of the following to submit a log to Loggly:

Logger.log("first log from meteor");
Logger.info("it will store this message with info tag");
Logger.info("all", "arguments", "will be stored");
Logger.info("my fancy object", {fancy: true});
Logger.log("log and wait of the response in a callback",
  function(err, result) {
    console.log(err); // normally - null
    console.log(result); // normally - { response: 'ok' }
});

Use Case #2 — Detecting Bugs on the Client

Loggly is not limited to just server-side logging. With a small modification we can also use Loggly to send logs from a Meteor client. So we can use Loggly to see what is happening across our entire Meteor application — client and server.

Example: Using Loggly to Capture Unhandled Exceptions.

Sometimes users can use our applications in unexpected ways. That may result in an unhandled exception. And, users are unlikely to report errors. So, without using some form of client-side logging, it is difficult for us to know that an error even occurred.

For example, consider the following:

Exception in template helper: TypeError: Cannot read property ‘demoOfUndefined’ of undefined at Object.Template.helpers(https://salesbox.io/xxx.js:xxx:xxx) at https://salesbox.io/xxx.js:xx:xxx at https://salesbox.io/xxx.js:xx:xxx at o.call (https://salesbox.io/xx.js:xx:xxx) at o.mustacheImpl (https://salesbox.io/xxx.js:xx:xxx) at Object.o.mustache (https://salesbox.io/xxx.js:xx:xxx) at null._render (https://salesbox.io/xxx.js:xx:xxx) at a (https://salesbox.io/xxx.js:73:xx:xxx) at https://salesbox.io/xxx.js:73:xx:xxx at Object.l._withCurrentView (https://salesbox.io/xxx.js:xx:xxx)

The error above would likely be printed out to the user console, meaning that we would be unlikely to learn about it. But, by leveraging window.onerror, we can make sure that a message is sent to to Loggly when unhanded exceptions occur. For example:

//on client-side
window.onerror = function (errorMsg, url, lineNumber) {
  logger.log(‘Error: ‘ + errorMsg + ‘ Script: ‘ + url + ‘ Line: ‘ +    lineNumber);
};

The unhandled exceptions will then appear in the Loggly user interface:

Meteor Logging usecase2

How to Use Loggly to Send Logs from the Client.

Since Meteor makes it trivial to send data from the client to the server, we can leverage Meteor.Methods to send a log from the client, to our server, and then to Loggly.

First, let’s install the Loggly package for Meteor:

meteor add miktam:loggly

Second, let’s create a Meteor method that can be called from the client-side:

//on server
Meteor.methods({
  clientLog: function(message) {
      Logger.log(message, [‘meteorClient’]);
  }

Finally, let’s try log something from the client-side:

Meteor.call(‘clientLog’, ‘this is a test’); //example of a call on client

For consistency, we can create a client side logger object so our client logging syntax will be similar to our server logging syntax:

//on client side
logger ={}
logger.log = function (message) {
  Meteor.call('clientLog', message);
}

Use Case #3 — Monitoring the Rest of the Meteor Stack

When running a Meteor application in production, you have to worry about more than just Meteor. You also need to think about the other components that allow Meteor to run. For example, Meteor runs on node, and node runs on a Linux. If node crashes or your server suffers a denial-of-service (DoS), it will affect your user’s experience. So you need to know about it.

If you are managing your own Meteor deployment, it means you may have to make sense of the following:

Meteor Logging usecase3a

A typical Meteor production deployment.

That is a lot of moving parts! Fortunately, Loggly not only can be used to monitor Meteor, but it can also be used to monitor the rest of the Meteor stack.

Example: Using Loggly to Monitor Linux and Detect Unusual Firewall Activity.

Meteor Logging usecase3b

Take a look at the above image. What you are looking at is firewall activity across a number of Linux servers. Do you see that spike in activity on December 10th? Any guess what that might be?

In this case, we discovered malicious attempts to connect to a port that should not have been enabled. The attacker never got past the firewall. But, monitoring software should have stopped the attack much earlier. It did not, and Loggly helped us find and fix the flaw.

How to Monitor Linux with Loggly.

If you are running Linux, the easiest way to monitor your firewall is to monitor the Linux system logs. Loggly provides you with three ways to do that: run Loggly’s configure syslog script, manually configure syslog-ng, or manually configure rsyslog.

Now that you are sending your Linux system logs to Loggly, you should be able to see the firewall traffic (and a lot more). Simply log into the Loggly user interface and search for logs related to the firewall (e.g. search UFW).


Michael Ghobrial is co-founder of salesbox.io, a developer, and an attorney. He has been melding his love of technology and problem solving since he could reach a keyboard.  

The Loggly and SolarWinds trademarks, service marks, and logos are the exclusive property of SolarWinds Worldwide, LLC or its affiliates. All other trademarks are the property of their respective owners.
Mike Ghobrial

Mike Ghobrial