Data is King: Measuring the Impact of Logging on Your Application
I’m happy to announce that my interview with Robert Blumen is now up on Software Engineering Radio (sponsored by IEEE Software). I’d encourage you all to go there, but make sure you budget some time because you’re sure to find a ton of interesting stuff that will keep you listening for many many hours. Robert and the rest of the team at SE Radio are doing an awesome job of pulling together some fascinating content on a wide range of topics.
In this post, I’d like to dive a little deeper on a comment I made in the interview and many times in the past – and on which I have often had pushback. Here is the quote (around 12 minutes in):
“I’m a firm believer in logging way too much. I don’t see a downside.”
Taken at face value, this is obviously a little hyperbolic. But I’m assuming that if you’re writing software, you’re already very well aware that you have to make compromises to make progress. The key to being able to live with those compromises is to base them on data. If you don’t have the data you need, then figure out how to get it and delay the decision until you have it. If you can’t wait, you should at least start gathering the data so that you can sanity-check the decision in the future.
How Big an Impact Does Logging Have on My Application?
This simple principle (Data is King) is a big part of why I’m working away at Loggly to make it easier to grok the data that is so plentiful in logs. So how does this tie to my quote? Because you don’t have to take my word for it. You can determine how much logging is too much for you just by running a few simple tests.
Profiling will tell you more than you need to know about this (and is always lots of fun), but there are even simpler things you can do to get “good enough” data. Most logging frameworks are very lightweight, so the predominant performance issue is less about the framework itself and more about how you use (or abuse) it.
For example, if you log the full class path, method name, file name and line number for every log message you generate, you’re going to chew more CPU cycles than if you don’t. Obviously there can be value in this information, and you need to decide for yourself whether it is worth the overhead, but you shouldn’t make that decision without at least running some simple tests to get the data that tells you how many extra cycles it is going to chew.
Getting that data is pretty simple: You can probably write a test bed in 10 minutes because you’re only measuring one thing. Let’s say you want to test how long it takes to log a static string. You could write a test bed that looks like this:
class LogTest {
  static Logger LOG = Logger.getLogger(LogTest.class);

  private Long testInfoStrStatic(int iters) {
    long t0 = System.nanoTime();
    for (int i = 0; i < iters; i++) {
      LOG.info("String static");
    }
    return System.nanoTime() - t0;
  }

  public static void main(String[] args) {
    int iters = Integer.parseInt(args[0]);
    Test t = new Test();
    long elapsed = t.testInfoStrStatic(iters);
    LOG.info("logging a static string " + iters + " times took "
            + elapsed + "ns, " + (elapsed/iters) + "ns/iteration");
  }
}
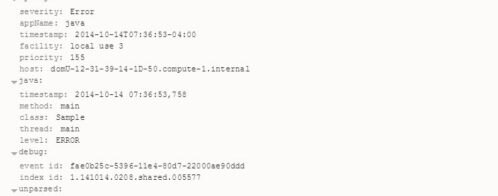
and here is the format definition from the log4j properties file:
log4j.appender.A1.layout.ConversionPattern=%d{ISO8601} %t %C{1}.%M %p: %m%n
Pretty simple, right?
Expanding this test to include log messages that are the result of string concatenation or to check whether the log level is active is also pretty simple.
Here are some results that illustrate how large the difference can be between using your logging framework well and using it less well. Each test was run using 1,000,000 iterations of each test loop, with INFO logging enabled, and DEBUG level disabled. These results are from a single test, which is not the way to measure this stuff. You should rerun these tests until you start seeing stable values. Since these numbers are meant for illustrative purposes only, however, they are good enough…
| Test | Total run time (milliseconds) | Run time per iteration (microseconds) |
|---|---|---|
| empty loop | 1.462 | 0.001 |
| INFO level, static string | 53772.212 | 53.772 |
| INFO level, string concat | 61385.400 | 61.385 |
| INFO level, static string, level check | 59732.765 | 59.732 |
| INFO level, string concat, level check | 62794.746 | 62.794 |
| DEBUG level, static string | 9.732 | 0.009 |
| DEBUG level, string concat | 59.551 | 0.059 |
| DEBUG level, static string, level check | 14.386 | 0.014 |
| DEBUG level, string concat, level check | 11.428 | 0.011 |
Looking solely at this data, it’s pretty clear that the biggest win is to not log at all. None of the debug level logs actually resulted in any output, and we can clearly see that we’re a lot better off in these tests in terms of time spent.
It’s tempting to say that there is a big difference between the debug concat string test and the others in the DEBUG group, but a single test run is not enough data to make that claim very strongly. Intuitively, I want to say that this is obvious because creating a concatenated string simply must take more cycles than reusing a static reference. But rather than rely on my intuition, I’ll just run the test again. And again. And again. As many times as I need to to get consistent results. Its a cheap test, so I can run it 100 times in the background while I’m working on other things, and when I get the results back I’ll have much better ground to make the claim that avoiding unnecessary logging is a good thing.
You may be thinking at this point that I’ve just disproved the quote I started this post with. Didn’t I just show that no logging at all is the best thing to do from a performance point of view?
Well, yes and no.
Yes in the sense that doing nothing is always going to be faster than doing something. Especially if you’re a computer.
But there is a very compelling No in the sense that if the cost of doing something is low and provides information you otherwise wouldn’t have, then you can weigh the cost against the benefit. Take a look at the INFO results above. They take between 54 and 63 microseconds for each message output. Which means I can emit 16-18,000 log messages per second. Put another way, if you emit 160-180 of these messages per second, you’re only consuming about 1% of the available CPU.
Lets say that even this is too big a hit for you. What else can you do?
Lets revisit our log4j config:
log4j.appender.A1.layout.ConversionPattern=%d{ISO8601} %t %C{1}.%M %p: %m%n
This is a pretty useful pattern. We get the class and method name to help trace back to the root cause of the issue. But what happens if you read the documentation and get scared by warnings like this?
%M: WARNING Generating caller location information is extremely slow and should be avoided unless execution speed is not an issue.
and this?
%C: WARNING Generating the caller class information is slow. Thus, use should be avoided unless execution speed is not an issue.
Just how slow are “extremely slow” and “slow”?
Lets find out…
If all we do is drop both of these from our pattern, we end up with this
log4j.appender.A1.layout.ConversionPattern=%d{ISO8601} %t %p: %m%n
Our INFO level messages drop from 54-63 microseconds to 32-43. Thats a 30-40% improvement. Not too bad, but we have lost some some pretty valuable information.
Let’s Try a Different Approach
All of these tests were run using the ConsoleAppender. If instead of dropping %C{1}.%M we change to the SyslogAppender, the range drops to 37-39 microseconds per call. This is a bit slower than the best we can do by dropping the “slow” and “extremely slow” patterns, but its also better than the worst, and we’ve kept some pretty valuable information in the message.
What if we do both? Dropping %C{1}.%M and using syslog drives the per-message range down to 11-13 usec. Not too bad at all. At that point, you can generate between 75 and 90 thousand log messages per second. Or, if you want to stick to your 1% of CPU budget, thats 750-900 messages per second.
Just for fun, I added %F and %L to the mix – both also have warning about being “slow” or “extremely slow.” Our pattern now looks like this:
log4j.appender.A1.layout.ConversionPattern=%d{ISO8601} %t %C{1}.%M %F:%L %p: %m%n
The impact? Our time range balloons to 73-84 usec. That is about 33% slower than our starting point, and it lets us emit 120-135 messages per second with our 1% budget. The warnings are merited, it appears.
All of the numbers above were generated on a 2.8 GHz Intel Core i7 iMac, using Java 7 running in debug mode in Eclipse. The purpose of presenting them is not for you to use them directly, but rather:
- To show you how much you can affect the impact of your logging in
your systems simply by configuring your logging framework to suit your
own needs - To show you that even a really poorly configured logging system can
still emit a lot more messages than you may have though with minimal
impact on your applications
Even more important than the numbers themselves is the core principle of this post:
Data is King
As I said at the beginning of the post, I’m not asking you to take my word for this. You can get numbers that use your language and framework of choice and make your own decisions about how much to log. In order to get these numbers, you’ll have to build a testbed so that instead of having an argument based on opinion, you can have a discussion with a firm foundation in facts. Once you have that data, you’ll probably find that you’re more comfortable logging more than you were before. Which lets me stand by my claim that you should log “too much.”
The Loggly and SolarWinds trademarks, service marks, and logos are the exclusive property of SolarWinds Worldwide, LLC or its affiliates. All other trademarks are the property of their respective owners.

Jon Gifford