New automated log parsing for Windows, Heroku, Python, and MongoDB
We’re proud to announce our new automated parsing for logs coming from Windows, Heroku, MongoDB, and Python. Our mission is to understand the logs you are sending so we can help you find and fix problems faster. That’s why we automatically parse more types of logs than any other log management solution.
Parsing transforms your raw text logs into structured data that can be more easily analyzed. It allows you to plot charts showing statistics over time, trigger smart alerts, discover anomalies, and more!
Our competitors like Splunk and Elastic often require you to set up custom rules, which takes effort to set up and maintain. While we support custom formats as well, our goal is to do as much as possible automatically.
We also give you search results much faster than Splunk, thanks to our parsing. That’s because we automatically parse and index logs in our search engine when we receive them. Splunk normally parses them at search time, giving you 17x slower results when there are many matches to parse. While Splunk takes minutes to return complete results, Loggly often takes just seconds.
To continuously improve our customer experience, we monitor what types of applications customers send logs from and what percentage of those logs are automatically parsed. We picked Windows and Heroku first because they were the two most popular applications where we saw room for improvement. We’ll use this technique to add support for more applications in the near future.
Windows log parsing
The Windows Event Log is used by the Windows operating system for security events along with many application logs. Many of our customers use the open source NXLog agent to capture and send logs to Loggly. NXLog sends the event log using the syntax shown in the example below. Previously, customers had to use an extra plug-in to convert these logs to JSON or set up derived fields. Now we support this format natively. If you are currently using the JSON plug-in or derived fields, you may disable them to save space.
Below you can see an example log event from NXLog. This one is showing that Remote Desktop Services has created a TCP connection. It’s not pretty to read, which is why we parse out each of these fields and make them easy to explore.
[ Keywords="4611686018427387804" EventType="INFO" EventID="65" ProviderGuid="{1129C61B-B549-4251-8ED2-27250A1EDEC8}" Version="0" Task="4" OpcodeValue="13" RecordNumber="9612849" ActivityID="{F4217319-28D2-4DC9-A930-FF3D8B600000}" ThreadID="2288" Channel="Microsoft-Windows-RemoteDesktopServices-RdpCoreTS/Operational" Domain="NT AUTHORITY" AccountName="NETWORK SERVICE" UserID="NETWORK SERVICE" AccountType="Well Known Group" Category="RemoteFX module" Opcode="RCMProtocolImpl" ConnectionName="RDP-Tcp#91" EventReceivedTime="2017-09-30 23:39:39" SourceModuleName="eventlog" SourceModuleType="im_msvistalog"] Connection RDP-Tcp#91 created
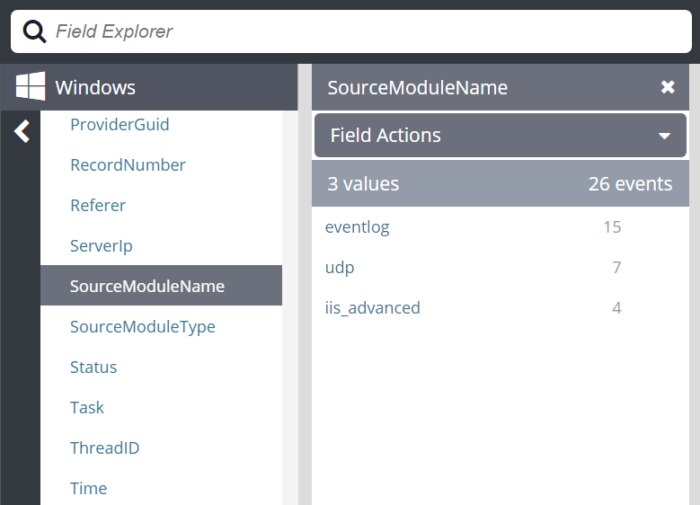
The logs are now visible in the Field Explorer, where you can get a very quick overview of the fields available and click to filter down into them.
Learn more in our Windows documentation.
Heroku log parsing
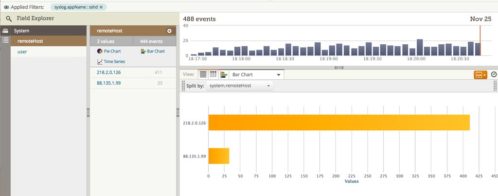
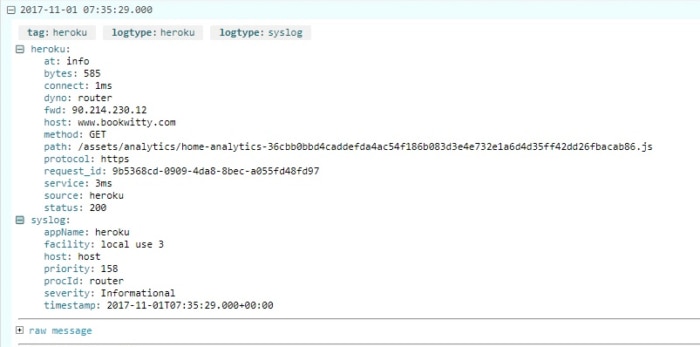
Heroku is a platform as a service that makes deploying and hosting apps in the cloud easier. It continues to be popular with startup companies, and now we are seeing even more large customers using it. We added support to automatically parse Heroku logs and extract the source and dyno of each event. We also parse each field of the router logs. This allows you to create useful dashboards showing how many requests are coming for each web host, the status codes, how long requests took, and more.
Learn more in our Heroku documentation.
Python log parsing
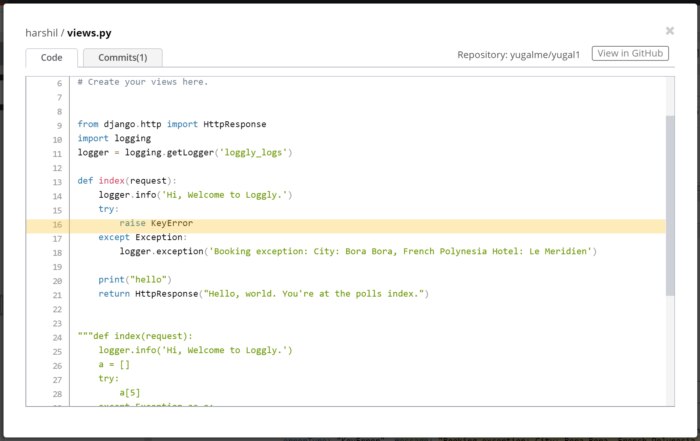
Python is a popular programming language, and one that we support with our GitHub integration, which shows you the exact line of code where your exception was generated, helping you quickly see what changes were made and by whom. We are the only log management solution with GitHub integrated right into your event view.
With Python you can choose from several log formatters. We’ve supported JSON-formatted logs for many years. Now we also have support for the default formatter, and we parse out the message, stack trace, error type, and exception message fields when they are available.
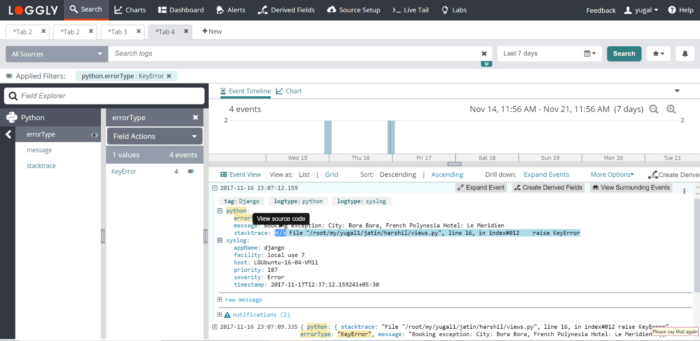
When you click the little blue icon next to the stack trace, Loggly opens up the code view from GitHub showing the exact line where the exception was thrown. This can help your developers quickly troubleshoot errors in the code.
Learn more in our Python documentation and our GitHub integration documentation.
MongoDB log parsing
MongoDB is a popular database that stores JSON documents. This makes the schema much more flexible than rigid database tables. It’s also easy to use in JavaScript web apps, mobile apps, and more. For MongoDB logs, we automatically parse out the timestamp, component, context, command, and command details. This allows you to quickly see what changes were made to your database and when.

Learn more in our MongoDB documentation.
With these new fields, you now have more insight into errors, security issues, and performance. They will make your stack more easily observable, and help you identify and troubleshoot issues faster. For this reason, we highly encourage you to send logs from these applications to Loggly. We will continue adding support for more applications in the near future.
Now that you can see how easily Loggly can parse logs, signup for a FREE no-credit card required Loggly Trial and trace issues down to their root cause.
>> Signup Now for a Free Loggly Trial
The Loggly and SolarWinds trademarks, service marks, and logos are the exclusive property of SolarWinds Worldwide, LLC or its affiliates. All other trademarks are the property of their respective owners.
Jason Skowronski

