One-Minute Windows Performance Analysis
Optimizing server performance doesn’t have to take you hours. Just a one-minute quick check can ensure that your Windows server is running smoothly. Windows has several tools that help you review the status of your environment. These tools give you a quick overview and help you catch major issues before they become critical downtime for your application. With a quick server checkup and log analysis using a solution like Loggly, you can identify small anomalies that point to future critical issues.
You might wonder why you need a one-minute performance analysis. It can serve two main functions:
- To see how your Windows server is functioning and to detect any minor issues that could turn into bigger ones.
- To troubleshoot current performance issues.
Ideally, you would want to use these quick checkups to preemptively identify issues before they become critical.
In this post, we’re going to show you how to use aggregated event logs for quick root cause analysis.
Why Windows Task Manager Won’t Help You Much
Windows Task Manager is a very basic way to perform a quick one-minute check on your local Windows server, but it doesn’t provide the necessary details that you need to pinpoint issues. It’s only useful when you’re dealing with a single server, not a production application.
In modern application environments, you’re typically dealing with many distributed servers in an enterprise web farm or cloud-based service. Logging into each server separately to view its Task Manager output is not an option: It would consume too much time, and it wouldn’t allow you to see the different outputs in context. It would also require every person on your team to have login credentials for every server, which not only adds management overhead but also might create security risks. Furthermore, autoscaling with services offered by Microsoft Azure and other cloud providers means that your virtual “servers” may have been terminated by the time you are ready to do your analysis. You need a way to capture, view, and analyze data in real time in a central location in order to find errors before your users find them. Task Manager can’t do this for you.
Using Your Log Data for One-Minute Performance Analysis
Aggregating all of your server logs with a solution like Loggly not only gives you a view of server performance (similar to Windows Task Manager but across all servers) but also can help you pinpoint errors much more effortlessly when you need a deeper analysis. Windows administrators know that sifting through multiple Event Viewer logs is tedious, but Loggly parses them for you.
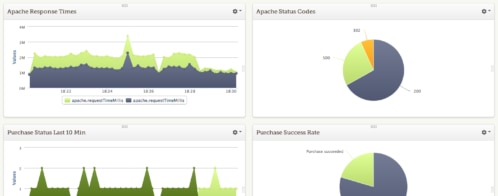
First, go to your Loggly dashboard and take a look at the Syslog Error section.

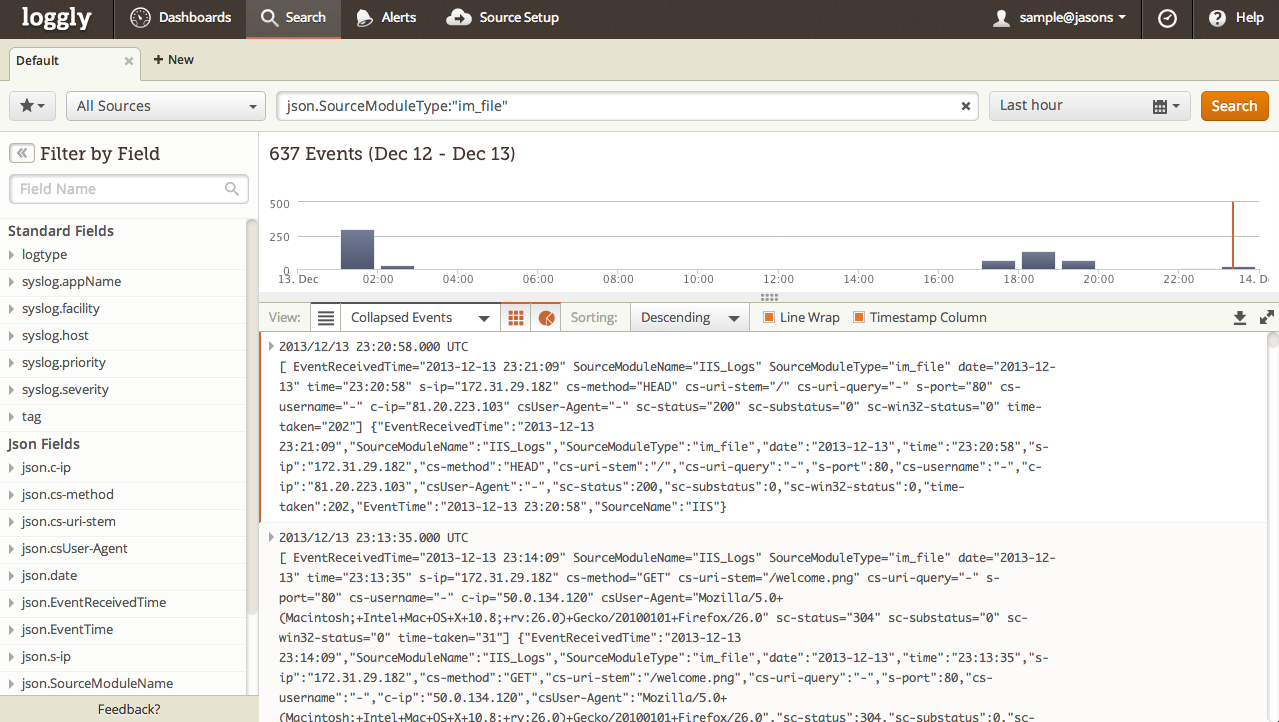
Notice that we have 87 syslog errors. When we click the Syslog Errors link, we’re shown a more detailed list of errors in the Event logs.

From these errors, we can see that our phpBB MySQL table is full. (We happened to have a phpBB application running on our demonstration server, but this same analysis applies to more advanced solutions such as IIS, SQL Server, or .NET applications.)
The full table would definitely cause a problem with application performance. If we tie in these times with poor performance, we can identify the issue without spending hours searching through Event Viewer logs in the Windows interface.
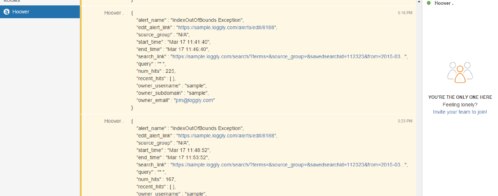
You can click on one of these errors to see parsed information. There is also a button to see surrounding events if the system has several different errors that point to the same issues. It’s pretty quick to pinpoint exactly when these errors occurred and link them to slow performance times on the server.
In the image above, the Windows event is shown in JSON. Expand it and you can view all information that you would normally view in Task Manager. Instead of flipping through several pages and watching Task Manager for hours, you can monitor Loggly logs for any suspicious resource spikes and set alerts so that you’re proactively notified via email, PagerDuty, HipChat, or Slack.
In addition, you have direct access to application errors that could be affecting performance. You can also run analytics and filters on your logs to drill down directly to your problem. This makes Loggly a far more useful resource when an administrator needs to better understand resource issues. You must be able to detect issues such as poorly written code instead of throwing more resources at the problem.
For instance, suppose that your server resources spike every day at noon for no apparent reason. Using Loggly, you recognize that your .NET application runs several queries that return data to a specific report. Using this information, you could then research server resource allocation while running these queries. Loggly could help you find exactly what query and application causes the server crash each day at noon, reducing the amount of time it takes to determine the root cause for your server crashes.
Summary: What to Do Next
The quick checks that we have described in this blog post can stop critical crashes before they happen. A one-minute performance analysis on a production application running on multiple servers (whether in a server farm, in the cloud, or even on elastic virtual servers) is much more efficient with a centralized log management solution.
You can even set up alerts that essentially run these checks for you and let you know when you need to take action. Combine alerts with Loggly analytics, and you can shave hours off of investigations into resource issues on your server.
In the first section’s example, we needed to empty the session table for phpBB before the application fails, but you can use this quick performance check for any application. Using Loggly, you can better identify root cause issues into any major (even minor) server performance issue. Loggly’s complementary performance check on your Windows servers saves you hours of research and analysis. Just a few minutes a day are all you need to find resource issues with your servers that could turn into critical events.
Use Windows Task Manager when you just want a quick review of a single server’s performance and use a log management solution like Loggly to perform a full, cohesive analysis on critical performance issues across all your distributed systems and your whole environment.
The Loggly and SolarWinds trademarks, service marks, and logos are the exclusive property of SolarWinds Worldwide, LLC or its affiliates. All other trademarks are the property of their respective owners.

Jennifer Marsh