Optimizing Tableau Performance with Loggly
If you use Tableau to query a database directly, this blog post will help you use Loggly to quickly find queries that have high latency. With this information you can determine if indices need to be added in your database schema for optimizing Tableau performance.
When connected directly to a database, Tableau essentially does drag-and-drop query-building using graphics. Internally, that query is being translated into a declarative language such as SQL which is processed and transferred back into graphics for the user.
Tableau is architected in a way that maps very well to relational algebra, so it can elegantly translate a graphical interface into a query language and does not require the user to import the data from the database into an analytical silo. Tableau enables users to explore data quickly. Usually, when one is able to visualize data, further questions arise.
Lately I have been using Tableau to explore data produced by our backend system to continue improving search performance at Loggly. I have used Tableau for several years and think the product is awesome.
However, as I collected more data and tried to answer more questions, the performance of my Tableau queries started to deteriorate. So now I had two problems at hand: how to analyze data to improve performance at Loggly using Tableau, and how to improve Tableau’s own query performance.
I decided to use Loggly to analyze Tableau’s logs, as Tableau recommends analyzing its own logs to improve its query performance. Since Tableau stores its logs in JSON format, it is not easy to analyze them with Tableau itself, which requires a tabular data format. Here is an example of a Tableau log entry:
I currently send data into a MySQL store on a periodic basis and connect to it directly with Tableau. Our data is constantly changing so we do not use extracts, but query the database directly from Tableau. Some of the tables have dozens of columns, as we track many parameters related to performance. Here is how to quickly analyze your Tableau logs with Loggly. If you don’t have a Loggly account already, you can create one now. It’s free for up to 200MB per day. Now, let’s send Tableau’s log data to Loggly. If you just want to send the data once, you can use the following Python script:
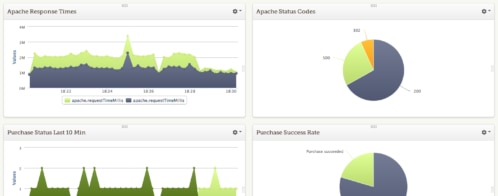
Now, let’s log in to Loggly. The log data will have already been parsed as JSON fields so that we can search on specific fields.
We want to find log messages emitted when a query ends, and in particular, we want queries that have a WHERE or GROUP BY clause, so that we can look at columns that may need indices:
Here is our search: tag:tableau json.k:"end-query" WHERE GROUP
In Loggly, we can create a Grid View to look at the fields we are interested in. We want to see how many rows were returned, how long the query took, and which query was used.
You can then sort in descending order to see the slowest queries first.
Here is how it looks: 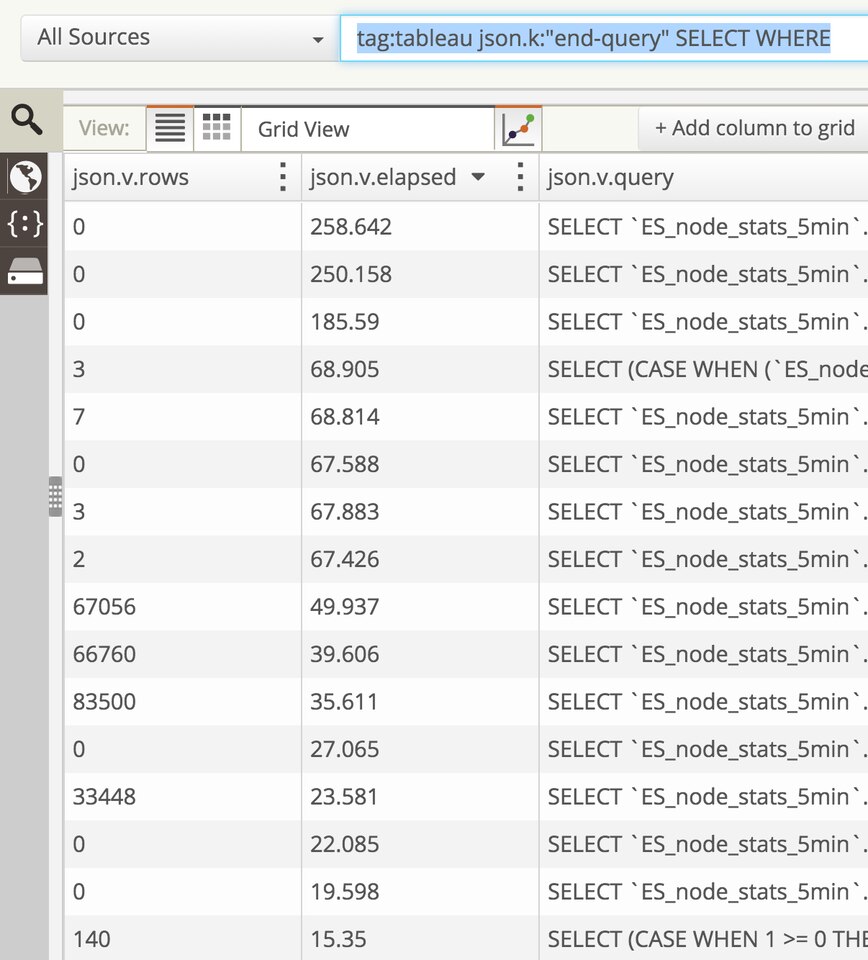
Now you can inspect the slowest queries and see if we have indices set up for the columns being used either in JOINs or as part of a WHERE or GROUP BY clause.
Monitoring Tableau’s Performance with Loggly
If you want to monitor Tableau’s performance on an ongoing basis, you can use a more complex version of the Python script introduced above.
This will correctly deal with timestamps, so that we can plot trends. Additionally, it will transform some values, such as “-“, which Loggly does not like, so we replace them with “None”.
You can specify the time range of data you want to extract from the log files and then run the script periodically, either by using a cron job in Mac or with the Windows Task Scheduler.
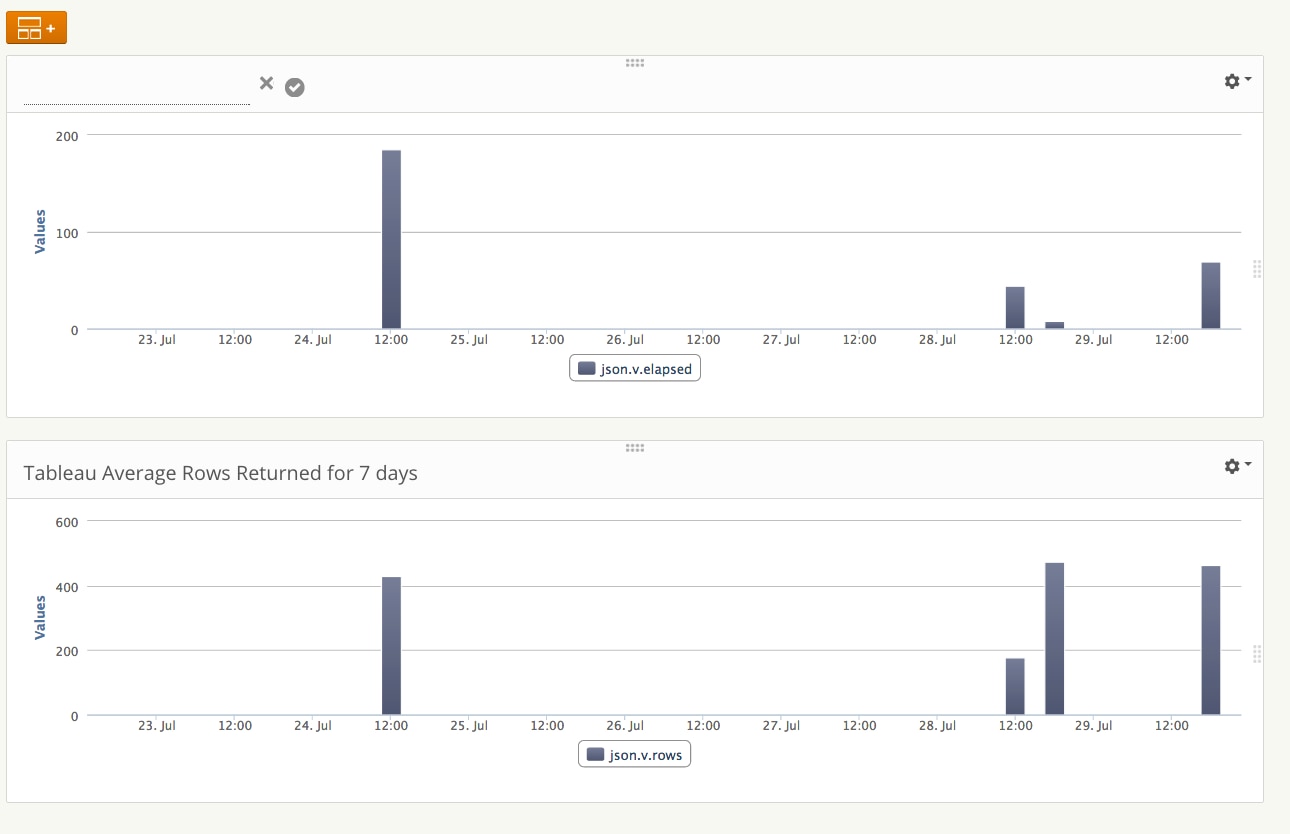
After collecting data for a few days, you can plot dashboards in Loggly to show your query performance (I like to look at the highest latency), as well as other metrics such as average rows returned from queries. In my particular case, I have reduced the worst performance by creating indices on columns that I use as filters.
References
Here is a good early article that shows the founder’s trajectory and vision for Tableau’s technology: https://www.sramanamitra.com/2010/03/05/how-to-get-a-20-million-pre-money-valuation-for-series-a-tableau-software-ceo-christian-chabot-part-3/
Here is Tableau’s official recommendation for improving Database Query Performance: https://kb.tableau.com/articles/knowledgebase/database-query-performance
The Loggly and SolarWinds trademarks, service marks, and logos are the exclusive property of SolarWinds Worldwide, LLC or its affiliates. All other trademarks are the property of their respective owners.

Mauricio Roman