Smart Alerts for Anomaly Detection and Data Aggregations
When something is going wrong with your application, you’ll want to know about it as quickly as possible. That’s where alerting, a feature of Loggly Standard, Pro, and Enterprise plans, comes into play.
You can now receive alerts based on data aggregations and our anomaly detection algorithms. All of these alerts fire as soon as data meets the criteria you have set, based on the time range you specify.
Data Aggregation Alerts Help You Act on Trends in Log Data
Data (or statistical) aggregation means a data point that is a combination of more than one measurement or value. Examples include averages (a combination of amount and time) or percentiles (a combination of amount and rank).
Loggly allows to analyze your log data and use statistical aggregations to understand what’s happening. All metrics are available via our point-and-click Trends graphing, so there are no new commands for you to learn.
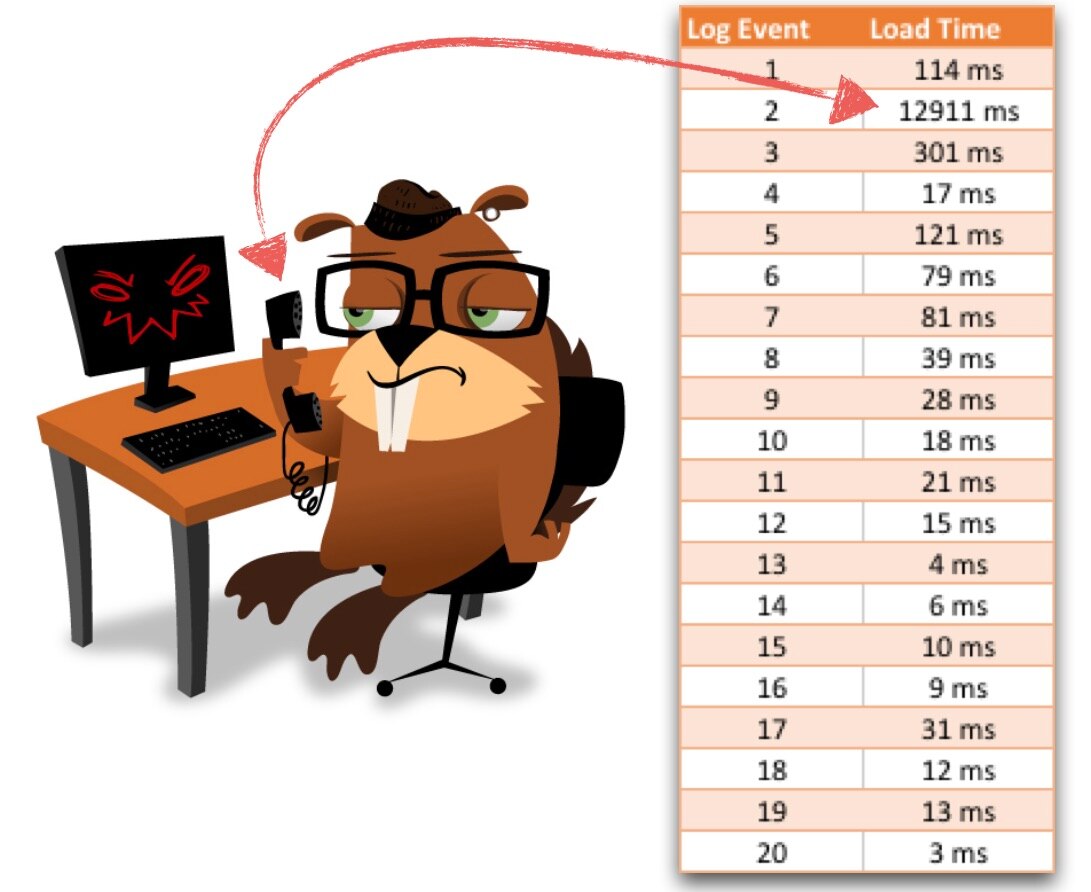
Let’s say that a customer has complained about your app’s performance, and log data shows that this customer indeed experienced a page load time of almost 13 seconds. The question now is: Did this customer encounter a severe problem that many other customers (who just haven’t complained yet) ran into as well, or was it just an outlier?
For cases like this, percentiles allow you to quickly answer that exact question. You simply look at all the load times that have been recorded in your log data:
Once you sort these load times, you can determine the percentiles:
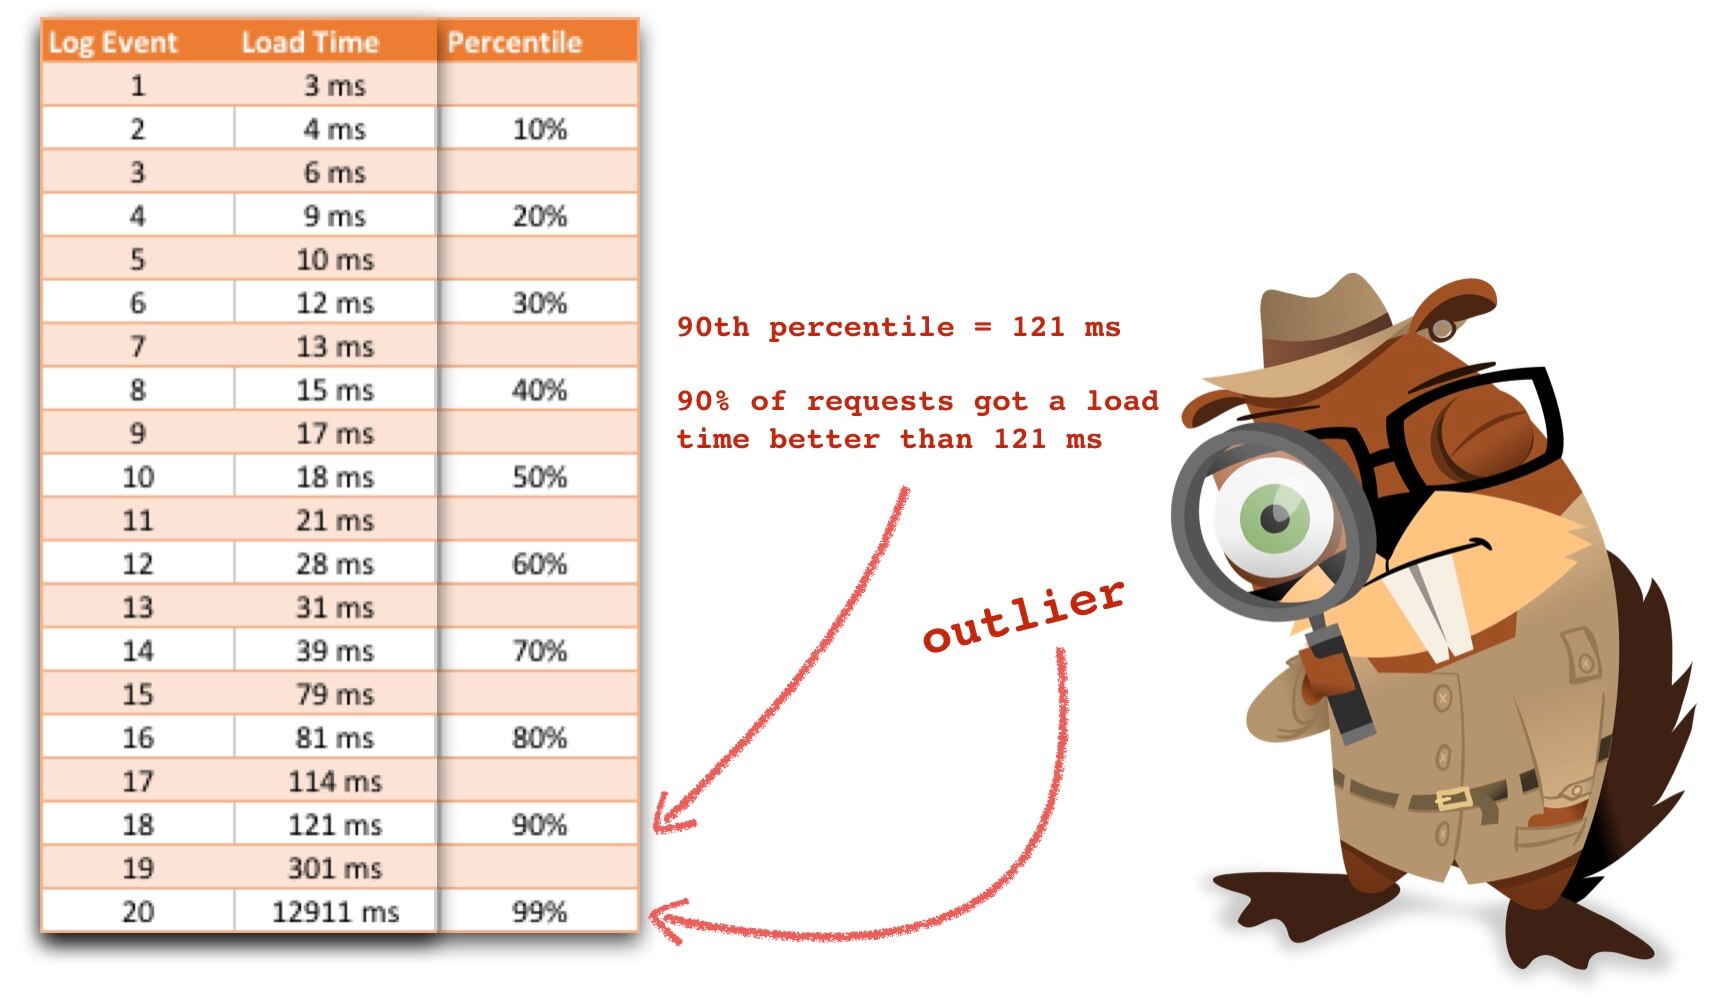
In this example, the load time of 121 ms is in the 90th percentile, which basically means that 90% of users did get page load times of 121 ms or better. The 13 s load time can easily be identified as an “outlier” and is not part of a larger group. Percentiles make this analysis easy even when you’re dealing with thousands or hundreds of thousands of log events.
Statistical aggregations, like percentiles, can also help you track conformance to Service Level Agreements (SLAs) that you may have with customers.
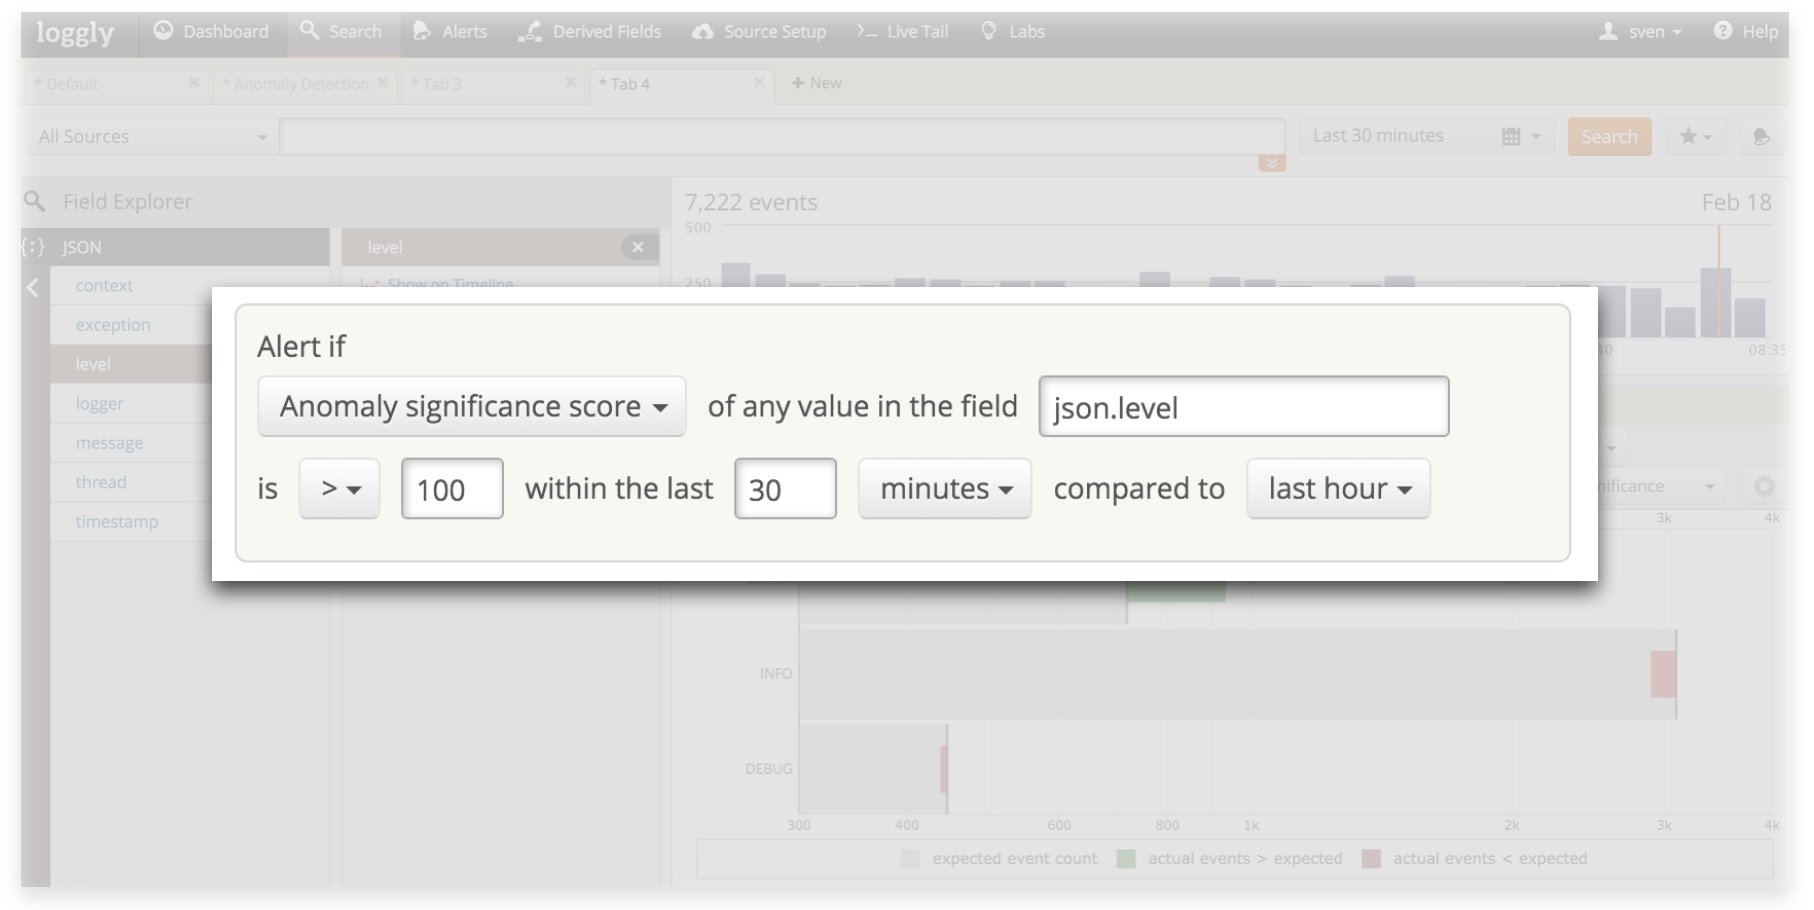
Loggly allows you to analyze your data based on percentiles and other aggregations, and you can now also set alerts based on aggregated values. You will find the relevant settings in the alert setup dialog box:

Anomaly Detection Surfaces the Unknowns
Statistical aggregations are a great way to surface potentially known issues in numeric fields in your logs. However, it’s not uncommon for things that you never thought about to be the ones that cause the really tricky problems. Anomaly detection alerts are a way to find out about things that you haven’t anticipated. You can tell Loggly to notify you of anything that deviates from normal levels in the log fields you want to monitor.
An example: the syslog.severity or json.level fields in your log messages have a lot of information. You might have a baseline level of ERROR and CRITICAL messages that don’t really signal trouble… but what if these values creep up? Let’s say that your normal ratio is 90% INFO and 10% ERROR and CRITICAL messages. Loggly anomaly detection alerts will notify you any of these values deviate from “normal” beyond a defined threshold. You can then go directly to the relevant events in Loggly to investigate.
Read this blog to learn more about how anomaly detection works.
Set Up Your Alerts in a Jiffy
You can create any of the alerts I describe above on the fly, right from the search page in Loggly. Just click on the bell button to the right of the search button.
Receive Alerts in HipChat, PagerDuty, Slack, VictorOps, or Wherever You Work
Like all Loggly alerts, you can specify one or more endpoints to which you’d like your alerts sent. If your team uses HipChat, PagerDuty, Slack, or VictorOps, it’s a lot easier to get notified through one of those systems, since you’re already spending a lot of quality time there. If you use a different system, you can quickly configure Loggly to connect to your endpoint via HTTP/S. All you have to do is specify your URL and whether you want a POST or GET request.
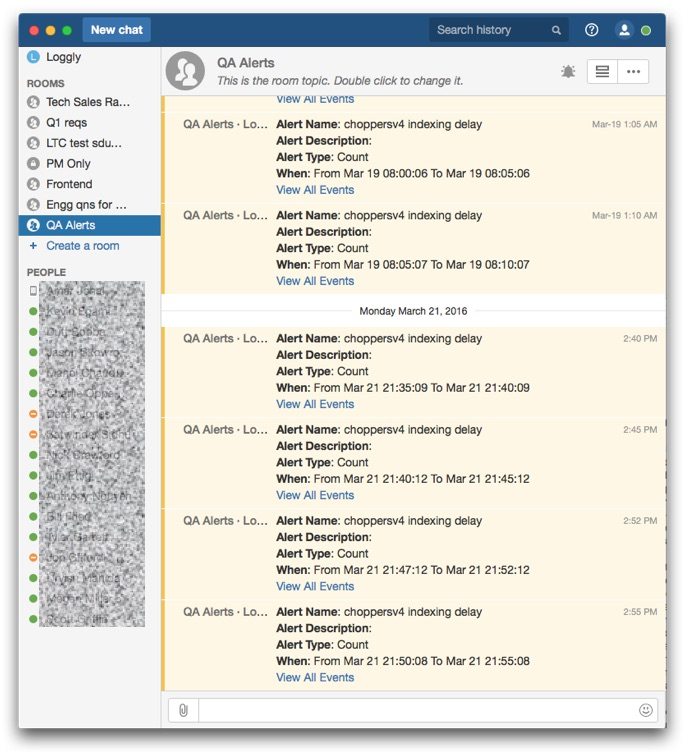
If you’re using HipChat or Slack, you will notice that we just overhauled the formatting of alerts in these messengers to improve readability:
Pump Up Your Alerts Now
Alerting is a must-have for any cloud-based business because the longer it takes to discover an issue, the more revenue you’re putting at risk.
Statistical aggregation alerts are a feature of all Loggly paid plans (Standard, Pro, or Enterprise), and anomaly detection alerts are available to Enterprise customers only. Users in a Loggly free trial have access to all Loggly features. So if you haven’t tried Loggly yet, you have one more reason to get started now!
The Loggly and SolarWinds trademarks, service marks, and logos are the exclusive property of SolarWinds Worldwide, LLC or its affiliates. All other trademarks are the property of their respective owners.
Sven Dummer
