Splunk Cloud vs. Loggly: 2019 Speed Test
The core ability to search through logs quickly and intuitively is the most important feature a log management system brings to the table. Being able to quickly and efficiently search through logs generated by an infrastructure stack allows DevOps professionals to rapidly find and address problems, as well as confirm deployments and configuration changes. Because raw speed has such a direct impact on the usefulness of these products, we will compare to see which performs the best.
Both SolarWinds® Loggly® and Splunk Cloud offer robust and comprehensive search features. In an effort to compare each platform based on this core feature, I decided to test the speed with which each of these platforms performed a variety of searches. I then compared the speeds between each of the products to determine which out-performed the other and proved to be the superior platform.
Why Speed Matters
Logs are commonly used for troubleshooting critical operational problems, and it’s essential to identify the root cause of these problems and fix them quickly. Time to resolution is critical because lack of availability for your site or application can negatively impact customer experience, result in data loss, or even revenue. Even web giants like Amazon experience outages. In 2018, their site was down for Prime Day, and it was estimated they lost $1 million per minute!
Giving you access to logs is the most essential job of a log management system. Time spent waiting for search results is time and money lost. Ideally, you want your search results to return within seconds, not minutes. Also, consider you may have to do several searches to identify the root cause. Furthermore, log management systems use search not just for finding text matches in logs, but they also underlie statistical trends, alerts, dashboards, and reports. When the system is monitoring the logs to fire alerts, it’s conducting a search against the incoming stream. Log queries will result in delayed alerts. Likewise, when you view a trendline of your site performance over the past day or week, the system is conducting a search behind the scenes to create that graph.
Search is the essential ingredient behind almost every feature in the log management system. It’s important to pick a log management system that performs well, so you can get answers and resolve problems quickly.
Goals for Testing Loggly vs. Splunk’s Searching Speed
Our goal is to determine which log management system offers the best search speed. We want to compare several common types of searches including simple text searches, searching recent and old data, searching for trends over time, and repeat searches.
It is essential the test be objective and compare similar searches across the exact same data. We’ll use the default settings since they are likely to be the most widely used, and this avoids favoring one system over another. One note: while Splunk does offer features like accelerated reports which pre-compute report queries in advance, this is not enabled by default and requires extra effort to configure.
While testing the search speed between SolarWinds Loggly and Splunk, the following will be enforced throughout the test:
- Set up both products to ingest the same logs from the same machine.
- Ingest up to five gigs of the same logs daily on both platforms.
- Test equivalent searches on each platform. Because each platform has its own unique searching syntax, I made sure when comparing results that each search query compared between the platform was as equivalent as possible.
- Testing equivalent products. Because Loggly is strictly a cloud-based solution, I decided to test Splunk Cloud instead of a locally-installed solution. This way, I am comparing cloud vs. cloud products.
How the Type of Search Impacts Performance
The type of search you perform can have a big impact on how long it takes to return. A search engine works by creating a lookup map for the terms you’re looking for, pointing to the location in the full data set where the matches are located. This prevents you from having to load and scan all data, and you can instead only load the relevant portions. There are many heuristics and optimizations for identifying the subset of data with matches. To understand these different queries, we need to start by defining a little bit of search engine lingo.
Dense vs. Sparse Results
One key term is whether a search is “dense” or “sparse”. By this, we mean whether there are many or few results in the result set. This has a potentially large impact on performance because if the system performs post-processing on the result set, it will take longer to perform if there are many results. On the other hand, a system that pre-processes the data before indexing into the search engine will be able to return results faster.
Cold vs. Hot Data
Another key consideration is whether we are searching “cold” or “hot” data. Cold data often refers to data that is old and not recently accessed. It’s frequently stored on disk, which is a cheaper way to store data, but also slower to read. In contrast, “hot” data is recently used and often stored in memory, which is more expensive but returns results much faster. For example, you can see the screenshot below which is searching for data over a week. Data stored at the beginning of the week is usually on disk, whereas data stored in the last hour could be cached in memory.
Fresh vs. Repeated Search
Sometimes after you perform a search you want to repeat it a short time after. This could be to get an update from the last few minutes, or to go back and re-examine something you looked at previously. If you just received the results, you don’t want to have to wait to process them all again; you would prefer them to load the old result immediately.
Statistics Search vs. Text Search
When people think of a search engine, they most commonly think about getting text results back. These text results are the logs that show in the log view. These text results can often be displayed fairly quickly, because you only need enough matches to fill up the display window. Additional results can be loaded in the background without affecting user experience.
On the other hand, statistics searches need to perform a calculation on the result set. For example, when displaying a timeline, the search engine must calculate a count of results within each column of the chart. If the system must calculate these statistics after loading the raw data from the results, this will take a long time. On the other hand, it will be much faster if the system is able to provide the count of matches directly without loading the raw data for each individual record.
Search Mode
Another consideration when benchmarking search speed between these two products is the Splunk search tiers. Splunk can perform a ‘Fast’, ‘Smart’, or ‘Verbose’ search for your chosen query. Fast mode is equivalent to searching and returning the raw text, whereas Verbose mode will search and return all the fields that are parsed from the log event.
Loggly has just one search mode that searches and returns full parsed fields, which is equivalent to Splunk’s verbose mode. Unless otherwise noted, we’ll use the verbose mode for a fair comparison.
Testing Methodology
Log Generation
Our log generator was a simple Ubuntu server hosting a Nginx-based web server running on an EC2 instance in AWS. Nginx was set up to log exact copies of its access logs to two different URLs. Both Loggly and Splunk were set up to consume those logs.
We then created a Python testing script that would alternate between making a valid request to the server resulting in a 200-code response and an incorrect call that would result in a 404 error response. I set up six versions of the script to run continuously in the background and populate data in the logs. Additionally, to help generate volume, I employed a flood test from loader.io that also hit a good and bad URL. This was scheduled to continuously hit every five minutes. I allowed all these generators to run for about seven days before I started my testing.
Time Measurement
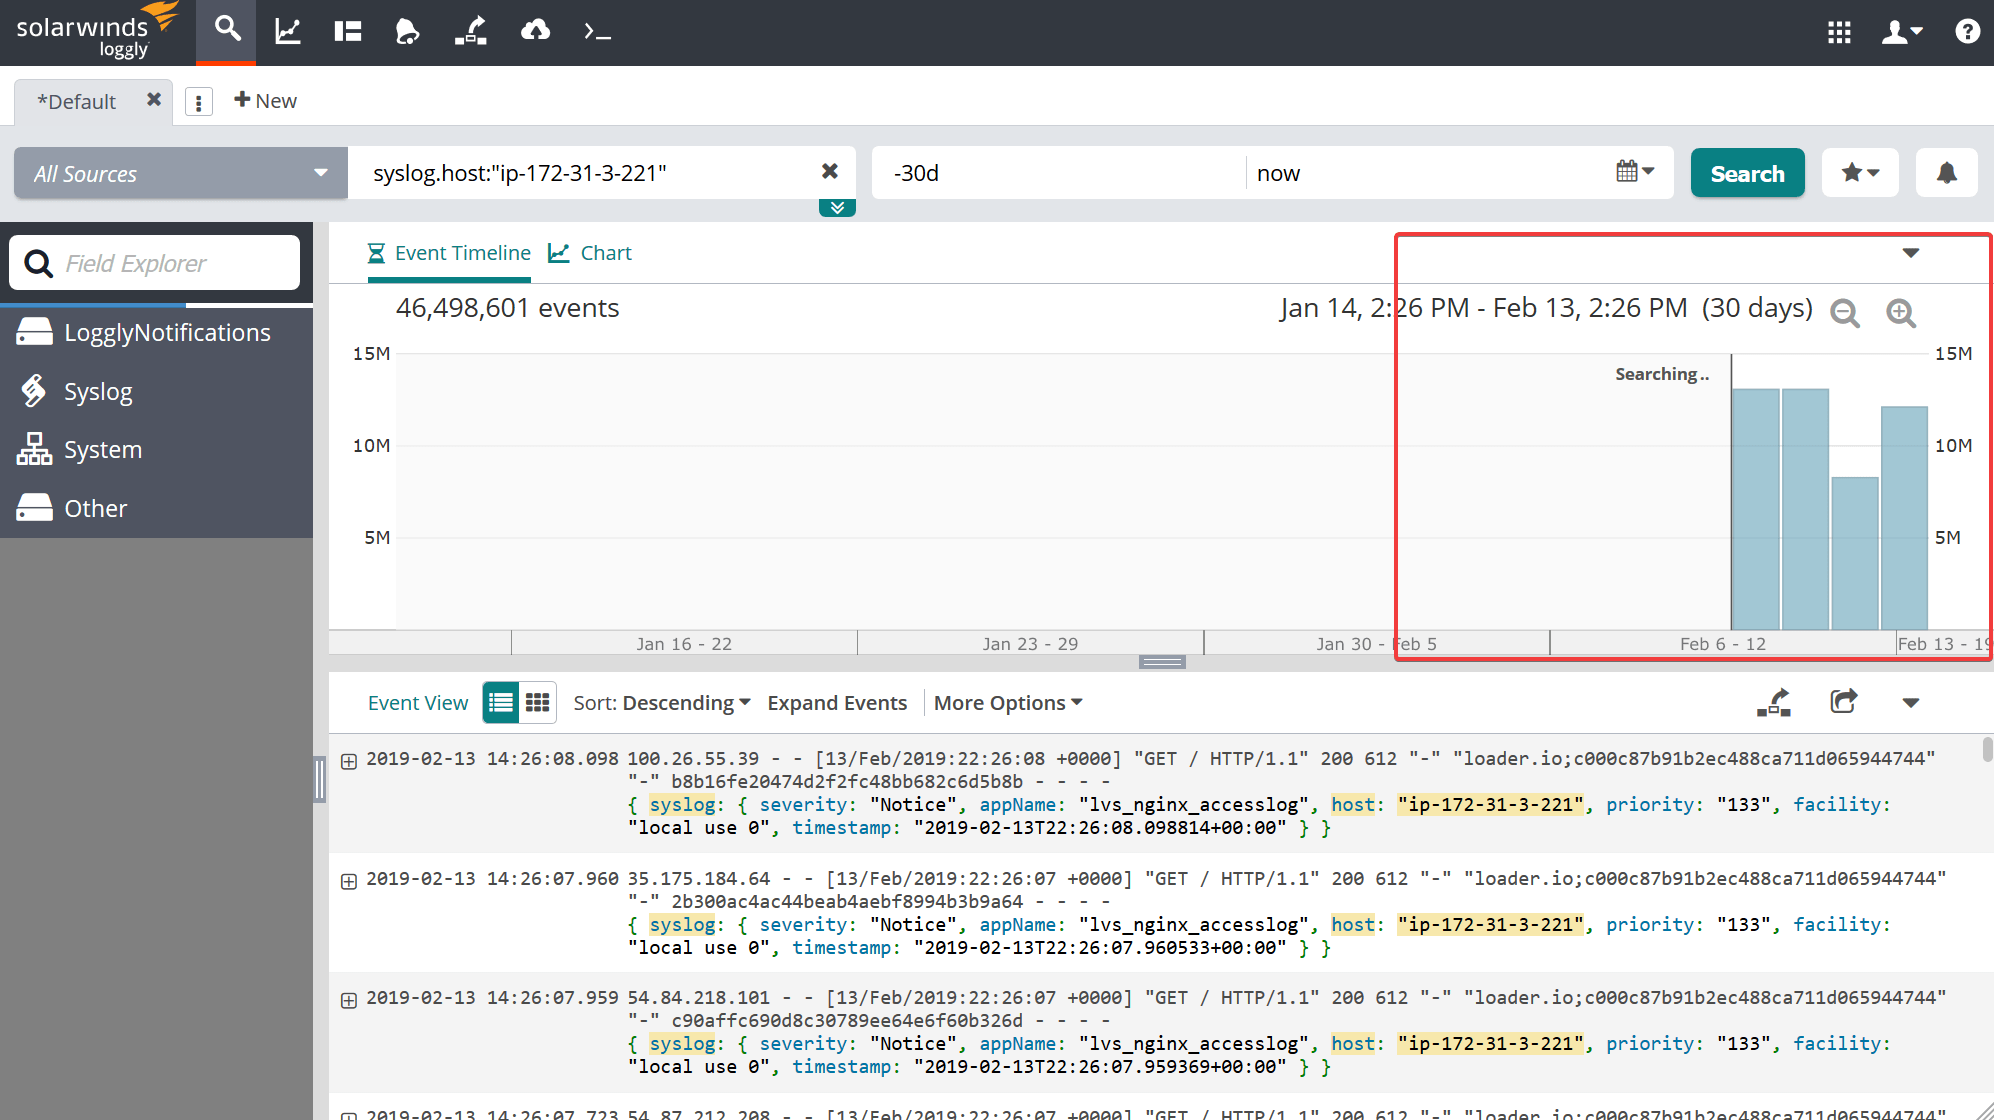
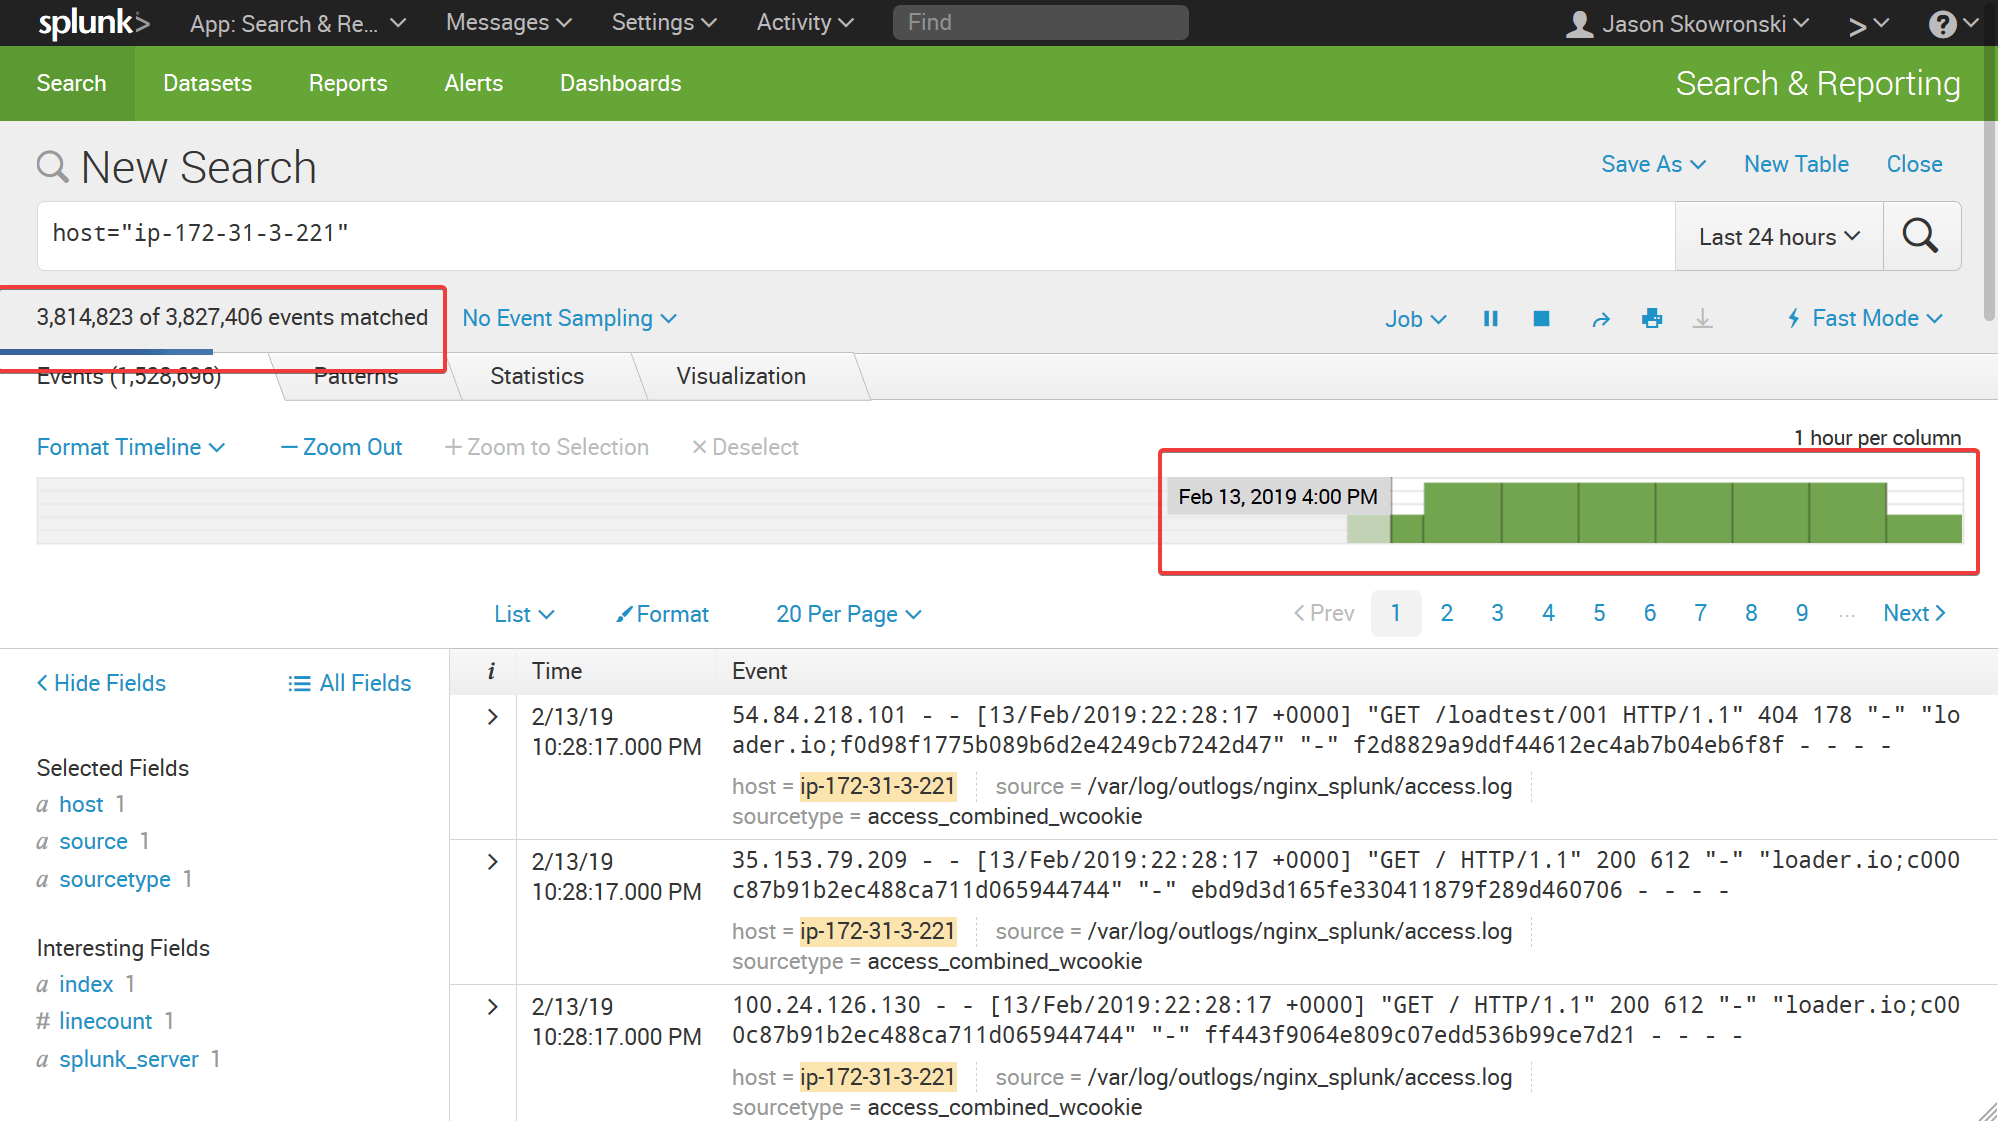
For text searches, the results are shown in the log portion of the window shown in the red box below. I started the stopwatch after pressing the search button and stopped when the log results appeared.

For timeline searches, the results are shown on the timeline graph as shown by the red highlighted box below. I started the stopwatch after pressing the search button and stopped when the timeline was fully loaded.
Results
Simple Text Search Over 24 Hours
Let’s start with the most common type of search a user would perform. We’re searching for a specific type of log over the past day on a specific host. This could be an error message right before a huge system failure, or a configuration change by a junior developer that brought your service to its knees. I set the search window on both platforms to 24 hours. Since error messages are typically a small percentage of all log events, I picked a substring that will return a sparse number of matches (< 1%). I’m also using Splunk’s fast mode for this comparison since we are looking for the raw log data.
The queries used for this test:
Loggly: syslog.host:”ip-172-31-3-221″ “/H9G”
Splunk: host=”ip-172-31-3-221” “/H9G*”
| Searched Time Period | Total Results Returned | Time to Finish: Splunk | Time to Finish:
Loggly |
| 24 hours | 21,195 | 2 seconds | 1 second |
Both products performed very well on this first test. This is fantastic since it’s such a fundamental use case for these products. It shows the results can be very fast for the right type of query.
Sparse Timeline Search
This search query measures how long it takes to return a count plotted over time. This is useful when examining whether a particular host was down during a window of time, if there was an increase or decrease in traffic, or a change in response time. We’ll count the number of logs from a particular host and URL code for two different time periods. I searched for results for 24 hours back and one week back. We’ll use the Verbose search mode for all following searches so both Splunk and Loggly return the same field data.
The queries used for this test:
Loggly: syslog.host:”ip-172-31-3-221″ “/H9G”
Splunk: host=”ip-172-31-3-221” “/H9G*”
| Searched Time Period | Total Results Returned | Time to Finish: Splunk | Time to Finish:
Loggly |
| 24 hours | 21,195 | 8 seconds | 4 seconds |
| 1 week | 148,177 | 2 minutes 31 seconds | 17 seconds |
Again, when the time windows were narrowed the finishing time for each remained rather close, but expanding the window out by even a few days always increased Splunk’s completion time considerably, while only adding a minor amount to the overall finishing time of Loggly.
The reason Loggly performed so much better than Splunk in this example is because Loggly pre-processes the data before adding it to the search index. In contrast, Splunk performs post-processing on the result set to parse out the fields. When there are many matches, it will take Splunk much longer to process the results.
Dense Timeline Search
This search query measures how long it takes to return a count of matches over time. This is useful when examining whether a particular host was down during a window of time, if there was an increase or decrease in traffic, or a change in response time.
We’ll count the number of logs from a particular host for three different time periods. Since we are requesting all the logs from a host, the results will be very dense (a high percentage of all logs). I searched for results for one hour back, 24 hours back, and finally one week back.
The queries used for this test:
Loggly: syslog.host:”ip-172-31-3-221″
Splunk: host=”ip-172-31-3-221″
| Searched Time Period | Total Results Returned | Time to Finish: Splunk | Time to Finish:
Loggly |
| 1 hour | 584,591 | 42 seconds | 2 seconds |
| 24 hours | 13,748,485 | 10 minutes 7 seconds | 13 seconds |
| 1 week | 102,621,988 | 1 hour 29 minutes 13 seconds | 15 seconds |
Here we see the effect of Splunk’s slower field parsing again, but it’s even worse given that there are more matches and thus more data to process.
Dense Cold Timeline Search
Not only do we need to search through events that have happened over the last two to three days, but there are many times when investigating logs a week or more old are required. With search, I wanted to see how long it would take to return older logs that fit these criteria.
The queries used for this test:
Loggly: syslog.host:”ip-172-31-3-221″
Splunk: host=”ip-172-31-3-221″
| Searched Time Period | Total Results Returned | Time to Finish: Splunk | Time to Finish:
Loggly |
| 7 days prior to search time with
24-hour window |
12,940,210 | 9 minutes 14 seconds | 9 seconds |
Again, we see a huge difference in performance between Splunk and Loggly. However, the cold data doesn’t seem to have a significant impact on the search times versus the most recent 24 hours. It appears that both Splunk and Loggly have optimized well for older data.
Repeat Timeline Search
When troubleshooting or analyzing issues in your logs, you often need to get updates on a log search that you did previously. This could involve looking to see if a fix was deployed, running an alert every minute, or updating a dashboard chart every five minutes. We’ll test to see whether each system can remember the results of prior searches so that repeat searches or small updates to the time range complete quickly.
The queries used for this test:
Loggly: syslog.host:”ip-172-31-3-221″ 404
Splunk: host=”ip-172-31-3-221″ 404
| Searched Time Period | Time to Finish: Splunk
Search First Run |
Time to Finish: Splunk Search Second Run | Time to Finish:
Loggly Search First Run |
Time to Finish: Loggly Search Second Run |
| Last 24 hours | 4 minutes 48 seconds | 3 minutes 49 seconds | 8.53 seconds | 2.14 seconds |
Here we can see Loggly offers much faster performance on a repeated search, whereas Splunk had to reprocess the query from scratch. This is because Loggly caches the results of your query so that if you perform the search again within a short period of time, it will load quickly.
Conclusion
Looking at our data it’s clear that Loggly outperforms Splunk pretty handily on most of our searches. Splunk is approximately as fast when searching short time windows with sparse results. Splunk is slower when searching for verbose field data, longer time periods, trends over time, or repeating recent searches.
It’s interesting to consider how search engine technology contributes to these performance differences. Splunk was founded in 2003 and its search engine has also been around that long. Loggly is built on a newer search engine called ElasticSearch. It also has an incredible amount of fine-tuning to improve performance over the stock system.
Additionally, Loggly has added several custom-built features that enhance search performance. They parse all data before indexing so that searching for specific fields is very fast, as is returning the parsed field data. They’ve built extra search caching so that repeated searches return very quickly. Additionally, they’ve built a custom live-tail feature that allows you to stream logs from your machines to your browser window in near real-time.
The best way to know whether SolarWinds® Loggly® will be faster for your company is to try it out yourself. Loggly offers a free 14-day trial. Set it alongside your current log management solution and test the performance of both. Then, pick the best solution for your team. If you already have experience with both of these solutions, we’d love to hear which was faster for you!
The Loggly and SolarWinds trademarks, service marks, and logos are the exclusive property of SolarWinds Worldwide, LLC or its affiliates. All other trademarks are the property of their respective owners.

Jason Skowronski