Three Ways That Automated Log Summaries Take the Grunt Work out of Log Analysis
The first thing any good log management solution does is centralize all of your logs so you have easy access to analyze them. However, most log management platforms simply throw tools your way and don’t do much to remove the onerous work that is log analysis. It’s no wonder why most users can only extract basic insight from their logs, since they don’t have the time or motivation to learn advanced formulas or complex query languages.
At Loggly, we don’t believe in putting the burden on the users to know the contents of their logs or learn a special query language before extracting insight. This is why we aim to do as much of the work for you automatically. Loggly Dynamic Field Explorer™ is one of the first innovations in this space that changes the way you consume and analyze your logs.
In my last post, I discussed the ways that Field Explorer helps you by:
- Exposing insight before you search
- Supercharging even basic searches to lead you to answers faster
Today, I’ll be sharing the output of conversations I have had with Loggly power users over the last few weeks. I’ll describe a few examples of how they leverage Field Explorer to streamline their everyday workflows, and by doing so take a lot of the grunt work out of log analysis.
Tomorrow, I’ll be digging into these use cases with a live demo on a webinar that also includes Monex, a great Loggly customer. So be sure to register if you haven’t done so already!
Workflow #1: Quickly Assess if an Issue is a Bug in the Code or an Operational Issue
When you are troubleshooting an issue reported by a customer or a monitoring service, the first thing you most often need to assess is if it’s a bug in the code or an operations issue (a server out of memory, bad network connectivity, etc).
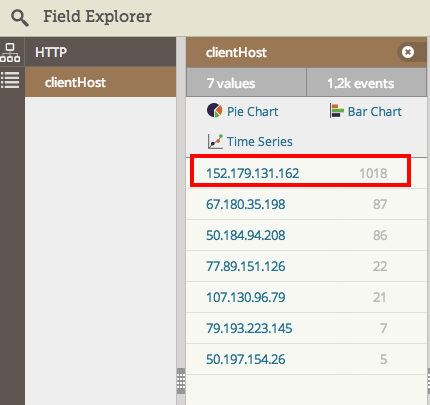
The most common recommendation from Field Explorer power users is to first use its automated summary and metrics. By looking at how errors are spread across your infrastructure, you can get an immediate indication of how widespread or isolated a problem is (and hence if it’s a specific instance in production that needs help or a code issue affecting all instances).
Many times, the distribution of errors split by the host shows only a handful (of errors that definitely should not be happening). Other times, you might have errors that normally happen at low volume in a healthy environment and one “unhealthy” instance that exhibits errors beyond this normal threshold. Field Explorer can help expose those in an instant by breaking down error counts by the host metadata we automatically collect or by any other context you include in your logs (container name, thread, etc.).
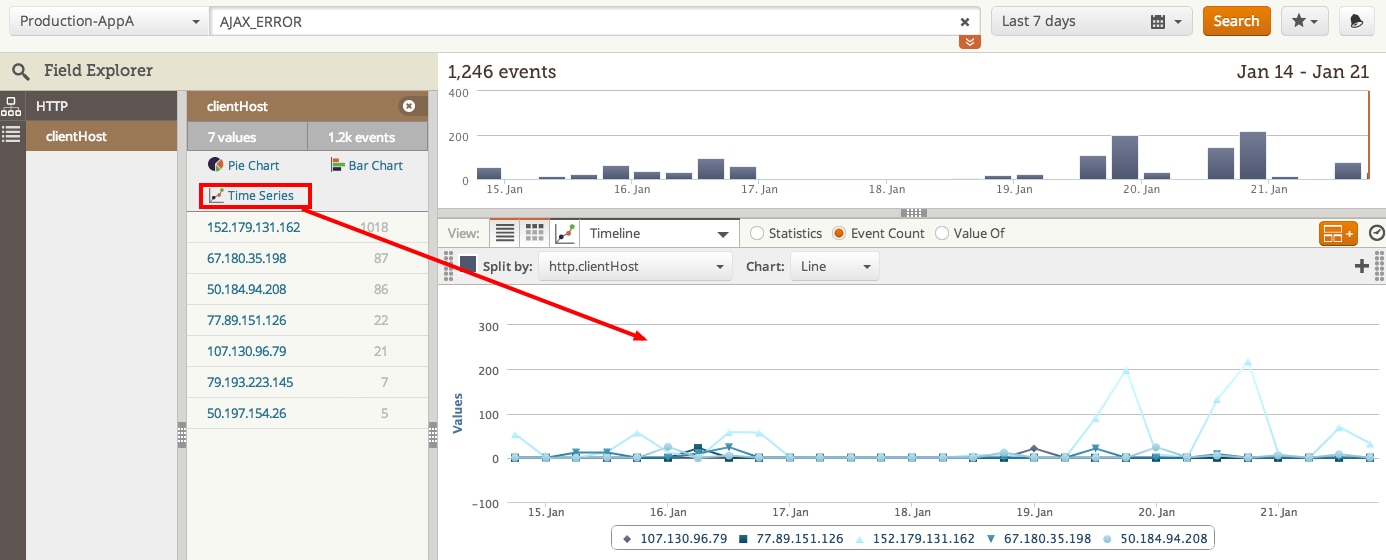
You can also take advantage of the one-click access to graphs to get a more visual feel for how your errors are distributed. In the example below, I pressed the “Time Series” button in Field Explorer.
Workflow #2: Less Friction to Your Ongoing Sanity Checks
While it’s a best practice to set up as many dashboards and alerts as possible, many users are hesitant to use them too much due to setup effort or for fear of creating noise. They may use dashboards and alerts only for a particular query with some ‘guaranteed” value—that is, they know they’ll need it in the future. Of course, this means a lot more sanity checks will happen with ad hoc queries, especially those deemed best for a human to manually confirm a behavior or pattern since some dynamic tweak or contextual comparison (e.g., a global versus per-component view) is needed.
The problem is that these types of ad hoc sanity checks rarely yield any insightful information since their goal is simply to confirm something you already expected. Over time, the friction to create, save, and execute these searches—in light of their minimal payoff—causes people to run fewer of them or to run them at lower and lower frequencies. This is especially true in a time crunch or when you are in firefighting mode.
Field Explorer eliminates the need to create all of these special queries and calculations. It automatically does the work for you and puts the information at your fingertips every time you log in. It’s easy to do as many sanity checks as you want: Simply cycle through the fields you are interested in and check out summaries of the values in your logs and the frequency with which they are seen. You can quickly go from verifying that requests are properly being load-balanced, to checking if any new types of errors are showing up, to seeing whether your users are using any new browser versions, and so on.
One Loggly e-commerce customer team mentioned how Field Explorer saved the day in regards to 404s—the often ignored error message. Almost all of their 404s were the result of user typos, so there wasn’t much payoff in understanding their root cause or even regularly checking in on them. But now that they automatically see a summary of all the 404 URLs, the insight is effortlessly pushed to them. Most recently, they discovered that a bunch of their ads on third-party sites were throwing 404s—wasting good advertising dollars and creating a really bad impression for their brand. By eliminating the need to create and execute a bunch of queries, Field Explorer took the work out of finding this important issue and has made sanity checks a regular part of the site team’s workflow.
Workflow #3: Gain an Instant View of What “Customer X” Has Done Recently
When users reach out for assistance, they’re not all able to give an accurate account of what led up to a particular problem or the exact details of their environment. Field Explorer makes it very easy to see what they did over a specific time period (say the last hour or even the last day) and expose any other context you have without writing a bunch of queries. This capability is especially important for companies seeking to empower first-line customer support agents to do some initial investigation and data collection or confirmation before escalating cases to the development team.
All you need to do is search for whatever customer identifier you have in your system, and Field Explorer will automatically present you with the list of fields and the context available in your logs for that customer ID. Then, it’s just a matter of cycling through the fields of interest and examining the insights automatically extracted from your logs. You don’t need to chase down a bunch of separate events that all have a bit of information.


In the example above, I can quickly tell that this customer is mostly using the latest version of Chrome and most recently working within the events tab (along with a lot of other context if I continue cycling through the available fields). If the customer mentioned a specific error message he or she was seeing, I would be able to search for that as well and get context for what action may have caused that with Field Explorer.
Easier Log Analysis Is the Mother of Better Application Logging
The more you use Loggly Dynamic Field Explorer, the more you will discover how powerful it is to include as much context as possible in all of your logs. Logging too much information and creating noise is less of a concern when the burden is not on you to construct the perfect queries that will generate insights. With Loggly doing much of the hard work to expose your fields and the top values for each one, it’s much easier to focus on your end goal of getting answers from your logs.
Learn how Monex Insight uses DFE to remove the grunt work from log analysis!
Wednesday, February 4, 2:00 p.m. Pacific Standard Time
Jonathan Keith, development manager for Monex Insight, a brokerage application serving more than 1.5 million consumers, will talk about how his team uses Loggly Dynamic Field Explorer for troubleshooting and debugging.
The Loggly and SolarWinds trademarks, service marks, and logos are the exclusive property of SolarWinds Worldwide, LLC or its affiliates. All other trademarks are the property of their respective owners.

Hector Angulo