Unleashing the Power of Loggly Live Tail with Windows PowerShell
How to Use Loggly Live Tail to Review Server Status Codes Real Time in Excel
| Want to learn even more? We have a Live Tail webinar ! |
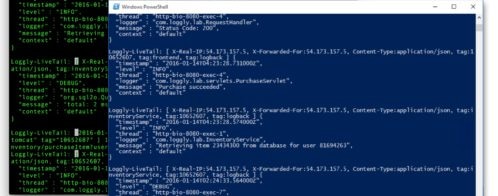
If you’re a Windows administrator, you’re probably unfamiliar with the traditional Unix command called tail -f . It allows an administrator to view file entries in real time as they occur in a command line interface. Loggly developed a custom spinoff of the traditional Unix Live Tail command for its own platform that gives administrators the ability to view log events in real time with their Loggly uploads. We’ll show you how to integrate PowerShell with Loggly’s Live Tail application to make a simple pie chart in Excel for reports.
Windows Server Logs: How Do You View Real-Time Server Response Codes?
Any Windows administrator working with a web farm knows the scenario: You need to view server logs for a specific date and time, and you want to filter out specific codes such as 302s and 301s. You want to know error response codes such as 500s versus the number of 200s. Perhaps you want to get some statistics on the number of server 500 errors returned during a certain time of day. For busy web servers, you could have millions of connections a day, and you just want some statistics for an hour during peak business activity. These reports can give you some insights on the success or failure of a recent deployment or on the health of your servers.
Loggly Live Tail is a true command line application that runs on Unix as well as on Windows. As with any command line utility you can “pipe” the output from one application to the next, creating a powerful flow of data processing. As an example, I will show you how you can capture log events for specific response codes with Loggly Live Tail, export them to Excel, and have a dynamic pie chart that shows key stakeholders specific statistics based on the performance of your servers and your applications. We’re going to show you how to hook PowerShell to Loggly’s Live Tail to create a report that presents your data dynamically and much more aesthetically pleasing than a raw log file.
Set Up Live Tail and Write the PowerShell Code
First, let’s take a look at the business rules before we write the PowerShell code.
- We want to view the number of 500 server errors and the number of 200s for a specific time of day.
- We want to filter out all other response codes.
- We only want response codes for HTTP requests.
- We want this data to be added to an Excel spreadsheet in real time.
- We want a pie chart that gives a graphical representation of the numbers.
Before you start with the PowerShell programming, you need to have Live Tail configured on your machine. Live Tail requires Java, so download it as well. The full description to set up Live Tail on Windows can be found here. Your authentication token can be found in your Live Tail dashboard.
With that said, it’s time to write some PowerShell code. Take a look at the full code, and we’ll step you through to explain it.
The first block of code sets up the PowerShell hook to your Loggly Live Tail program.
PowerShell lets you hook a command to the local PowerShell output window. Windows machines use java.exe to execute a jar file, so it’s our main command parameter. Notice that the second parameter in the ProcessStartInfo method is all of the Loggly command line arguments used to execute the program. The only sections you change in this code are the location of the jar file to match your own and the name of your Loggly domain.
Notice that the –m argument specifies HTTP. Loggly offers a regular expression filter to find log events that match your requirements. We use “HTTP” since we only want the HTTP events, but you can use your own filter rules.
The rest of the code in this block is standard to start a process in PowerShell. You can review Microsoft’s ProcessStartInfo class for a better understanding of these properties.
The next block of code sets up the Excel file.
We assume that ErrorGraph.xlsx is already created. Don’t forget to replace the Excel file path with your own directory location.
The first two lines of code are the variables used to contain the current date and time that we’ll then use to label the report’s time frame.
The next sections of code are in a try-finally statement. You might also see these statements referred to as the try-catch-finally statement. If you purely script PowerShell, you might be unfamiliar with these statements. A try-catch-finally statement traps any unforeseen errors and displays a user-friendly message. We skip the error messages for simplicity, but we need the finally section to close the Excel file if the program stops. We need this section because the file will have a lock on it if you don’t close it in your code.
The statements within the try block are the meat of the program.
We only track two response codes in our PowerShell code, but you could essentially log others such as 404s, 301s, and 302s.
This block of code loops through each log event as it’s returned from Loggly. It then parses the information and extracts only the response code. You could extract the rest of the information if it’s needed, but we’re only using the response code to keep our PowerShell source simple. If the response is 200, add it to the 200 pie chart section of our Excel graph. If it’s the 500 section, add it to the 500 pie chart section.
The final section runs after the script stops.
We use the $todate and $fromdate variables to timestamp the report. We then save it, close the file, and stop the Excel process.
You can run this code in your PowerShell ISE or save the code as a ps1 file and run it from your command line. Provided you have Live Tail configured and working, you only need to change the directory location for the Loggly jar file and the location of your Excel file, and this code should work without any more configurations. Note that you need Excel installed on the machine as well.
Review Your Excel File
We ran the PowerShell code for 10 minutes. The result of our code is the following pie chart.

Our program appends new counts to the existing ones, so if you decide to expand the graph to additional time frames, you can do it without changing the file. The PowerShell code writes specifically to the A and B columns in the fifth row, so again if you want to change this location you’d need to change it in your PowerShell code. Since we hook the graph to these two locations, the graph dynamically updates as the values change.
We only used two values, but you could essentially expand the spreadsheet and the code to account for any response codes in other administrative situations. For instance, you could change this graph to account for any 301 and 302 redirects if you want to know how many users are still accessing old, redirected locations in your web architecture. It could give you some insight on whether it’s feasible to retire older servers. You could also determine if your servers are returning 503 errors during busy time frames.
This is just one way you can use Loggly with PowerShell to create reports, review statistics, and analyze data for better insights into your server performance. Loggly’s analytics combined with PowerShell’s automation are powerful tools for administrators responsible for several servers in an enterprise environment. Live Tail is just one of Loggly’s many tools that reduce administrative work when you need to better understand your server logs.
How to get Live Tail
The Live Tail feature is part of the Enterprise subscription tier. If you don’t have an Enterprise subscription, you can upgrade by contacting your Loggly account manager. If you’re on a Standard or Pro subscription and not ready to upgrade your account but want to try Live Tail, you’ll be able to sign up for a special 14-day trial when you click on the Live Tail option in the Loggly menu bar. Live Tail is not available as a part of the Lite subscription. See our pricing page for details.
The technical documentation for Loggly Live Tail is here.
Related Reading:
Loggly Introduces Live Tail for the Cloud Era »
Loggly Live Tail Technical Documentation »
The Loggly and SolarWinds trademarks, service marks, and logos are the exclusive property of SolarWinds Worldwide, LLC or its affiliates. All other trademarks are the property of their respective owners.

Jennifer Marsh