Using Loggly For Troubleshooting Bugs In Your Code
Troubleshooting errors or exceptions in code is one of our customers’ top use cases. In this video, I go through a troubleshooting process with a hypothetical e-commerce site, where a bug could be costing the company thousands of dollars. We need to fix it fast!
Why Use Loggly for Troubleshooting?
Troubleshooting with Loggly:
- Accelerates time to resolution
- Reduces the impact of every issue on customers and revenue
- Improves developer and DevOps productivity
Troubleshooting Steps
Step One: Try to reproduce the problem.
Reproducing the problem could give you some peace of mind and clues of where to start looking. However, error messages often fail to provide much useful information, and some problems happen intermittently.
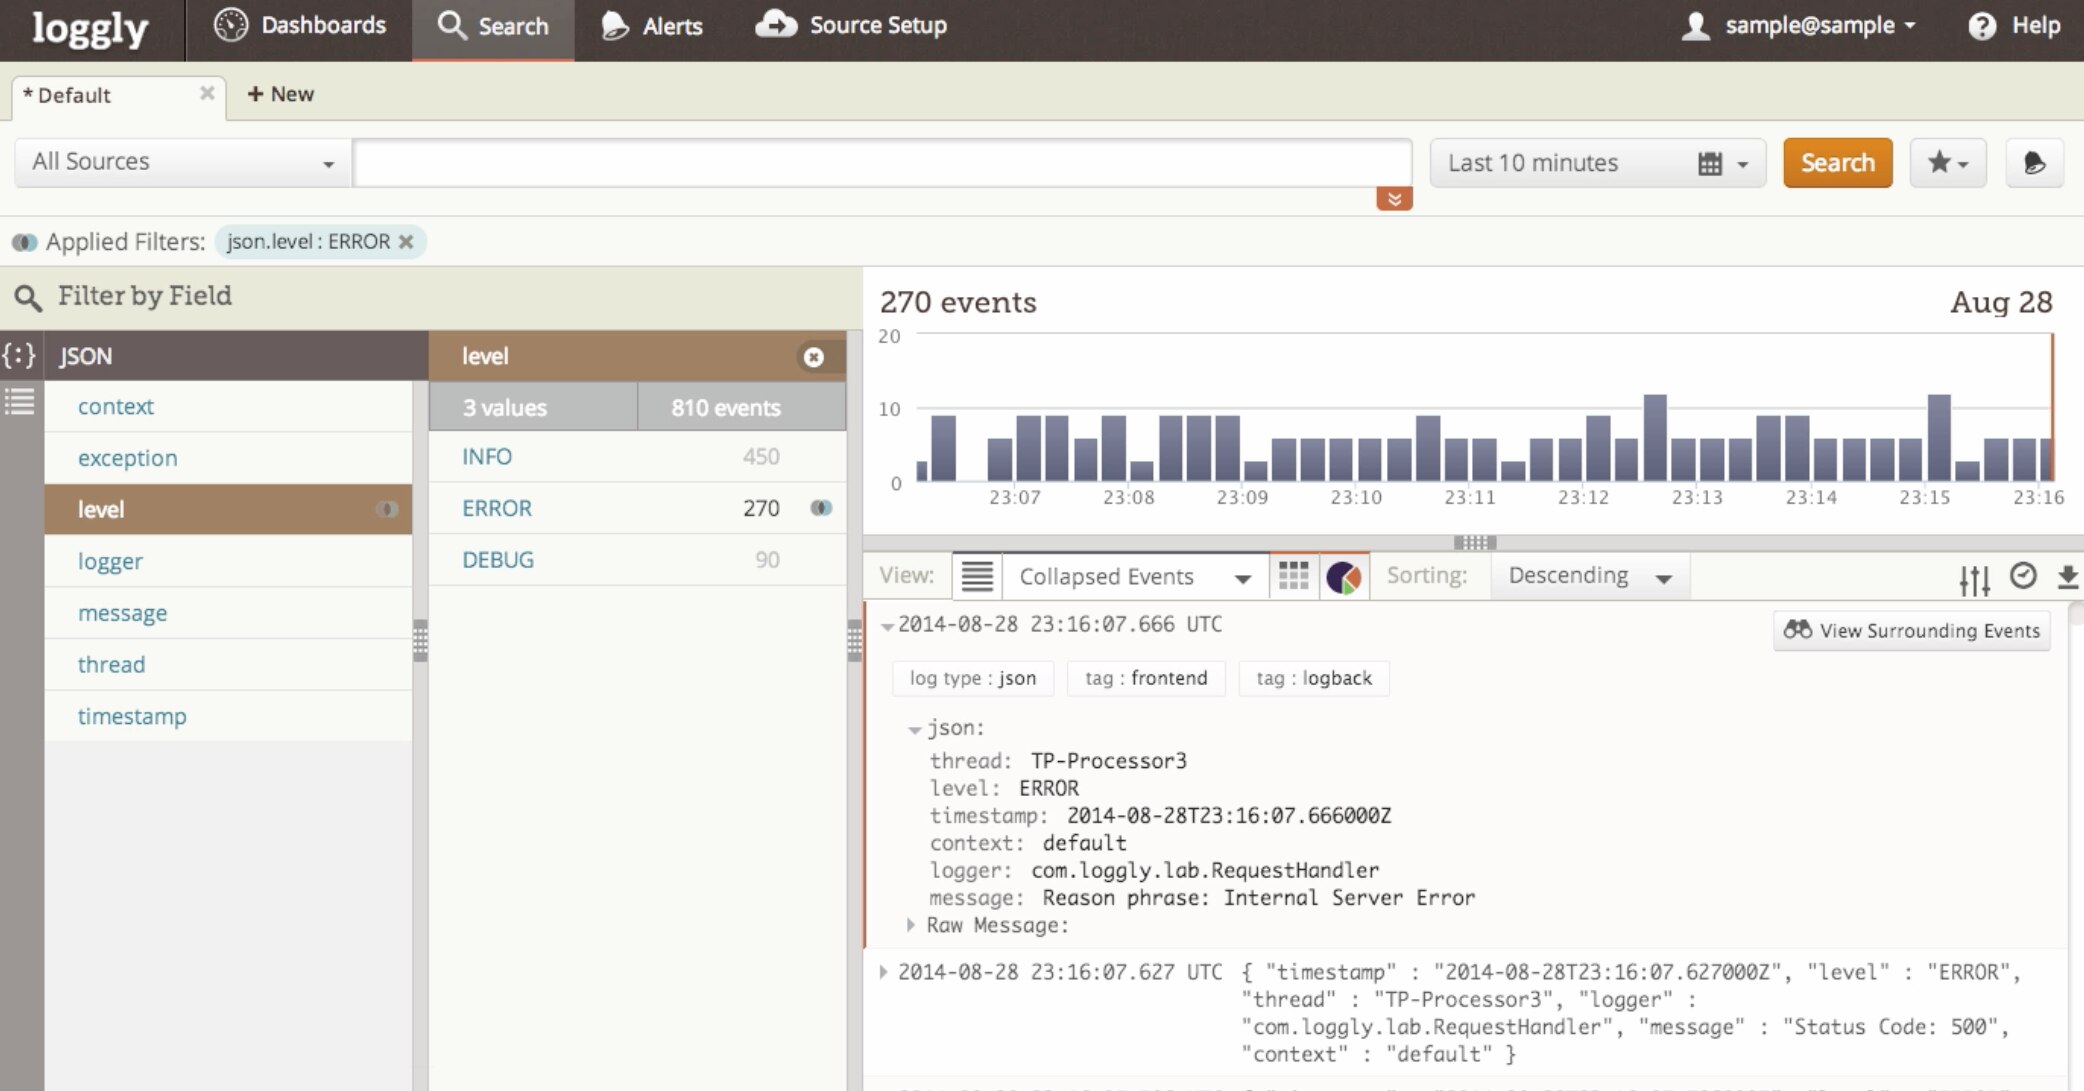
Step Two: Explore your logs to see what error messages are occurring.
Use Loggly Dynamic Field ExplorerTM to explore your log data based on its inherent groupings and structure. You can quickly see how many error messages are occurring and which are the most common.
Step Three: Drill down on a particular error from a particular user
You can search on the userID and Loggly will be able to display all of the relevant logs for that customer. You can then drill down on the events that have errors.
Step Four: See what led up to this error.
Simply scroll down in the event view to see what happened before an error for this same user ID. For a broader view, you can initiate a surround search by clicking the little binoculars in the upper right corner of each log entry.
Step Five: Inspect your application’s code.
Stack traces are especially valuable because they can tell you exact class and line number of a bug in your code, which you can view in GitHub or on your dev box. We’ve also set up our Java logging library with Logback to record the class name.
Step Six: File a bug report and get it fixed.
With Loggly, you can file tickets in JIRA right from your log analysis, with a single click. Just click on the “Create issue” link, and Loggly will automatically add relevant information from your log data analysis into your ticket. Loggly can also pre-populate common fields you use.

Problems Get Solved Much Faster with Loggly
Loggly presents your data in a structured fashion so that you can quickly browse it to find problems. And with instant analytics on the fields we parse, you can immediately see which problems are most common and what is causing them. So why not set up a free trial today?
The Loggly and SolarWinds trademarks, service marks, and logos are the exclusive property of SolarWinds Worldwide, LLC or its affiliates. All other trademarks are the property of their respective owners.

Jason Skowronski

