Using Loggly for Dev Support: My Top Use Case
I joined Loggly two months ago as a sales engineer after spending many years with my head in the logs. Literally. Most recently, I worked on the DevOps team at a large communications provider. With this experience under my belt, it was REALLY easy to appreciate the value that Loggly offers: Getting DevOps people to the data they need quickly, so they can solve problems and keep customers happy.
My Top Dev Support Use Case: Proactive Monitoring with Log Data
Our goal: Track the number of download failures to hardware devices from our web servers so that we could solve any systemic problems quickly, so they affected a minimum number of customers.
Metric: 404 status codes
The process would look like this:
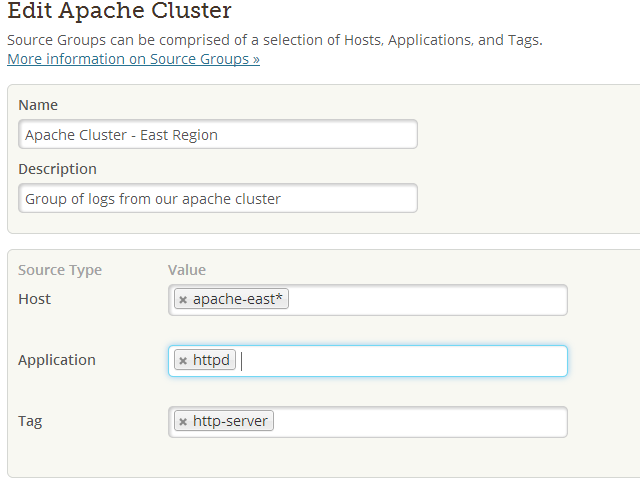
Step 1: Create source groups based on region.
Loggly source groups allow you to group log data based on hostnames, applications names and even tag(s). In my organization, we would have grouped our web servers based on the region that deployments or upgrades were scheduled. This allows the support group for that particular region to focus only on logs coming from that region.

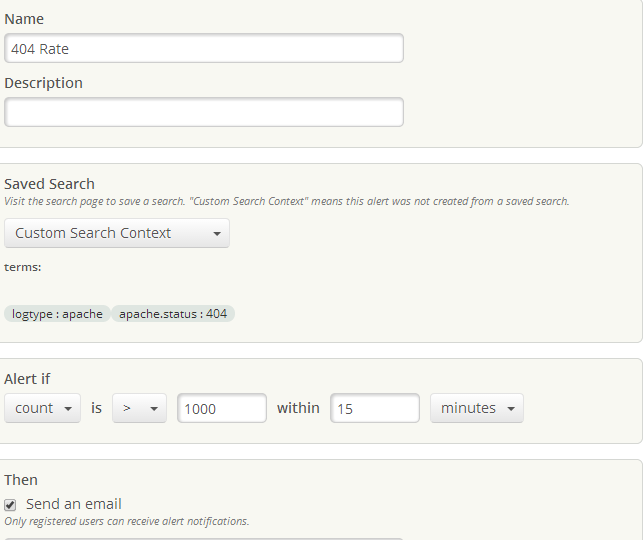
Step 2: Create an alert that would monitor for a specific error code that we would be accustomed to seeing with new deployments or releases.
In our case, we closely monitored apache web access logs and so a 404 error message is something that we had to look out for. Alerts are easy to set up in Loggly. First of all, the status code field is automatically parsed by the system. It’s easy to create a custom alert based on apache.status:”404″. For example, since we were dealing with thousands of hardware devices, I would probably have set an alert with the following threshold, if the log data detects a count of 1000+ hits within a 15 minute period then we had a problem. With Loggly, you can send alerts to either PagerDuty or email, but email would have worked fine for us since we were actively on top of the upgrades or new releases.

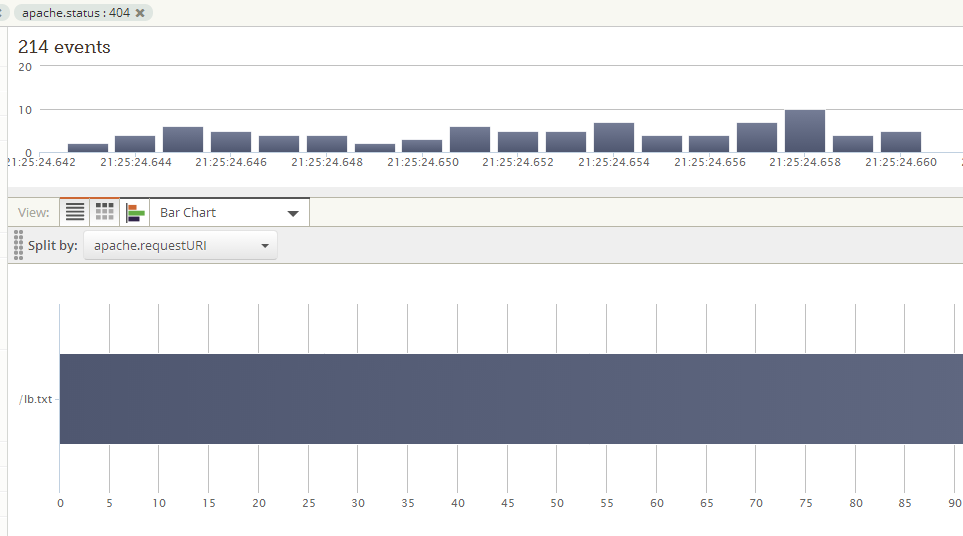
Step 3: Build an operational dashboard.
With the first two steps already in place, all Support would have to do is set up a dashboard widget, e.g. a pie/bar chart, and split the chart based on URI. What this means is that I would like to know what URL’s these hardware devices are requesting and then verify if the resources are missing on the web servers or if the device had a bad configuration.

As you can see from my screen shots, the three steps I described would make a support team very efficient, to the point where they could proactively monitor system behavior and resolve problems as they emerge in real time.
Having to ssh into multiple servers to figure out the number of 404 counts using tools like grep, sed, or awk is practical when you only have a handful of servers to monitor. However, it’s tedious and painful – and more importantly, it doesn’t scale at all as your server count grows. So why not make things easier on your Dev Support team? Unless your organization is really big and bureaucratic, you can put my three-step process in place in less than a day!
The Loggly and SolarWinds trademarks, service marks, and logos are the exclusive property of SolarWinds Worldwide, LLC or its affiliates. All other trademarks are the property of their respective owners.
Hoover J. Beaver

