Using Range Queries in Alerts: How to Find Operational Problems Before They Happen
A while back, Jon Gifford wrote a great post on how to use search to find problems from your log data. Following up on that, I wanted to focus in on one of the coolest features of the search functionality in Loggly: range queries.
There are a lot of situations where a numeric value can tell you if things are going right or wrong with your application – but you don’t know beforehand what that exact value would be. Range queries let you search ALL of the events that have occurred within a specific range – say, between 70 and 150 over over 100. You can examine those events after the fact to find a problem; but better yet, you can set one alert, or a series of escalating alerts that will proactively tell you when you need to take a look.
Here are some examples of range queries:
apache.status:[500 TO 599]
json.querytime_ms:[50 TO 100]
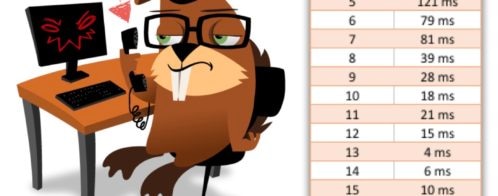
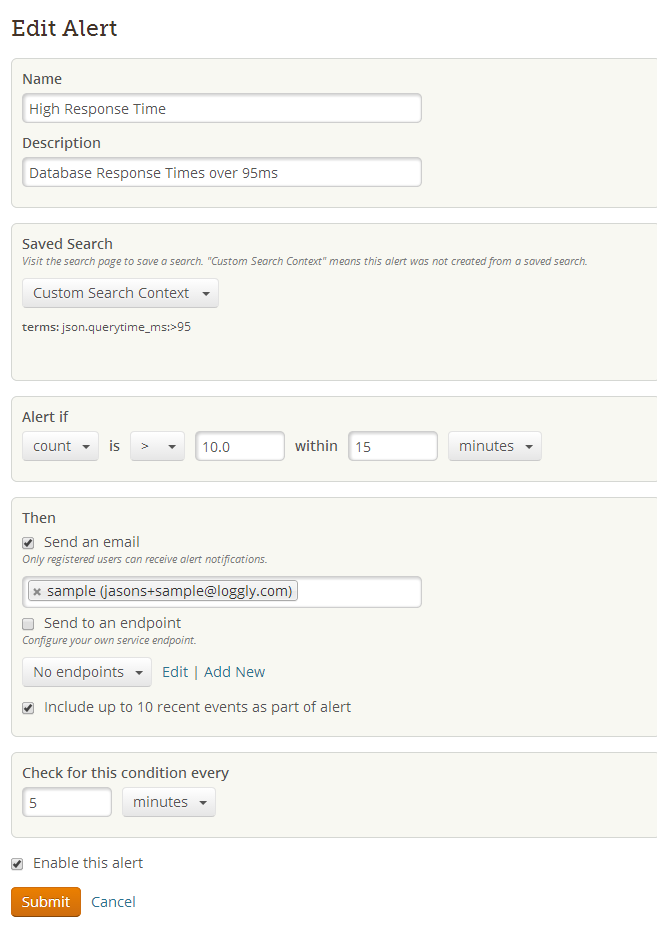
In my mind, nothing illustrates the value of range queries better than database response times. For a particular cloud-based application, you may know that any response times over 100 milliseconds are bad news. It’s easy to monitor this if you have your application create a log message every time it accesses the database, recording the database response time in JSON format. Then, go into Loggly and create an alert for database response times longer than 95 ms. Voilà! you pick up on sluggish behavior before it becomes a full-blown problem. The way you would write the range query would be json.querytime_ms:>95 . You can also have a search phrase like json.querytime_ms:[95 TO *] .
The combination of range queries plus alerting is incredibly powerful in the hands of DevOps people. These alerts are built into Loggly and can provide an early warning system for all types of issues that can cause grief. Even if you don’t know the exact condition or message that indicates a problem, you have a pretty easy way to stay on top of your applications and stay out of trouble.
The Loggly and SolarWinds trademarks, service marks, and logos are the exclusive property of SolarWinds Worldwide, LLC or its affiliates. All other trademarks are the property of their respective owners.

Hoover J. Beaver