Technical Resources
Educational Resources
APM Integrated Experience
Connect with Us
Monitoring fragmented logs from different servers, applications, and frameworks is complicated and time-consuming. Traditional Apache log monitoring tools cannot handle such complex workloads.
Most tools get slow when they have to sift through a large volume of logs, which can severely impede troubleshooting and increase the mean time to resolution (MTTR).
Analysis of text logs is not simple, and teams have to configure complex tools for the visualization of logs. It is not easy to work in tandem with different open-source tools.
SolarWinds® Loggly® simplifies Apache log monitoring by centralizing all your logs on the cloud and providing a powerful platform for analysis. It gives you a bird’s-eye view of your distributed stack and allows you to monitor and correlate your application and infrastructure logs together.
The Loggly agentless architecture allows you to get started within a few minutes, and you can start logging with simple scripts. You can use syslog daemons such as rsyslog to send Apache logs to Loggly. A big advantage with the cloud-based setup is that you can easily handle any spike in log volumes at a fraction of the cost for a similar self-hosted logging setup.
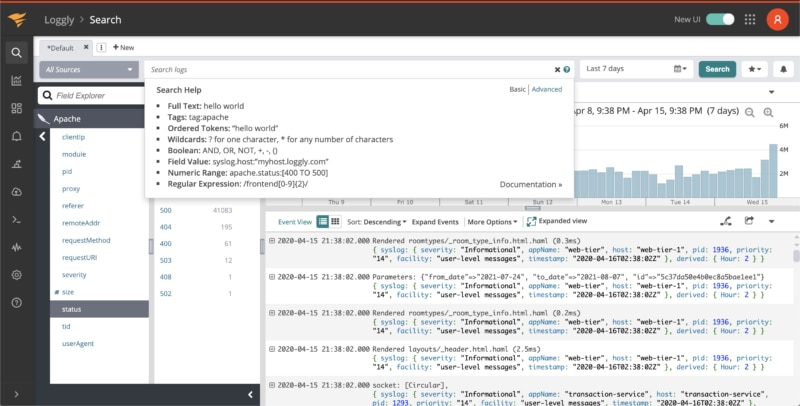
Teams often rely on greping log files or other traditional approaches to troubleshoot issues using Apache error logs. However, these methods can be ineffective in a distributed environment. Teams need to centralize all their logs and monitor them with a powerful tool which can track numerous HTTP error codes, response times, outlier IPs, and various other performance metrics in real time.
Loggly meets all such Apache log monitoring requirements. It offers automated parsing and interactive search to expedite your search and analysis. Moreover, with the Loggly dynamic field explorer, you can extract valuable insights from your logs without running any trial-and-error searches.
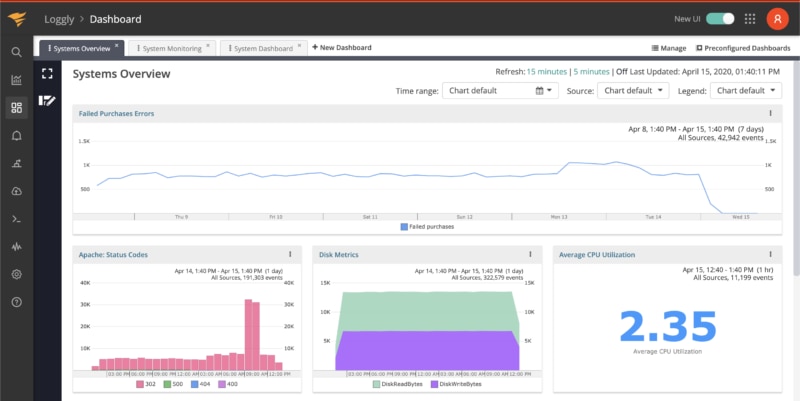
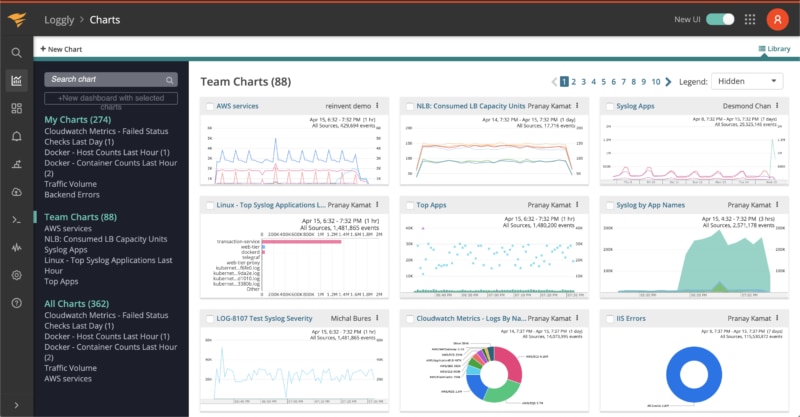
Unlike other Apache log viewers which lack visualization features, Loggly offers a preconfigured dashboard that allows seamless monitoring of Apache performance and usage metrics without complex configuration. You can choose different charts to customize your dashboard and sync all charts to a common period in a single click.
You can also download the dashboard in the form of a PNG image to include it in a report or email. The dashboards can also be shared, and you can define different access restrictions for your team members. With a visual overview of your distributed stack, you can easily spot anomalies or explore important trends over a period.