Technical Resources
Educational Resources
APM Integrated Experience
Connect with Us
Application logs can spiral out of control in a short time. IT teams often monitor logs from different servers, infrastructure, and cloud to troubleshoot issues; managing all these logs is not simple.
Modern web applications have a complex architecture which makes monitoring their availability and performance difficult. Traditional application performance monitoring tools alone cannot deal with this complexity.
Teams can struggle to pinpoint specific issues by monitoring event streams and text-based logs on their console. They lack advanced tools to get a quick overview of their environment with visualization.
SolarWinds® Loggly® can significantly augment your application performance monitoring capabilities by simplifying log management and analysis. It offers a cloud-based service for the aggregation of logs, which helps you correlate different events and get to the root cause of issues faster.
Loggly supports all types of text-based logs from a wide range of sources, including cloud-native technologies. With Loggly, you don’t have to install an agent. You can send most of your logs to Loggly over syslog or refer to its documentation to find simple scripts for the purpose. Loggly can also automatically archive your logs to AWS S3 buckets once they have gone past their one-week retention period.
With Loggly, you can gain a deeper insight into every detail of your application. While you can use dedicated application performance monitoring tools to assess the application health with aggregated metrics, analyzing logs with Loggly can help you get to the root cause of issues.
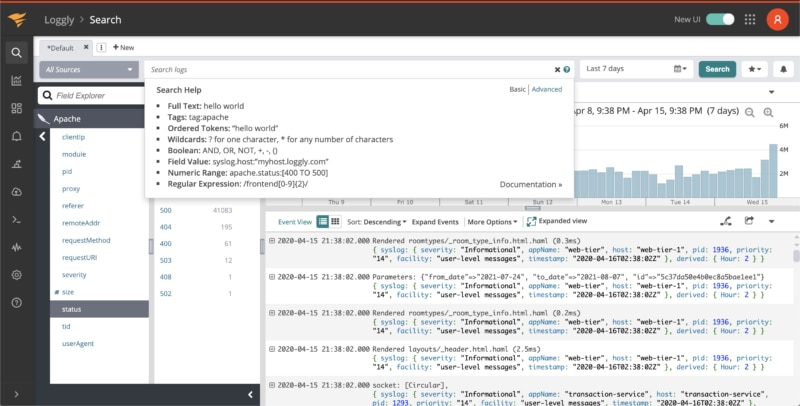
It provides visibility throughout your stack, as you can sift through massive log volumes and get quick results for all your search queries. With dynamic field explorer automatically updating parsed logs under various fields, Loggly adds significant agility to your search and analysis. You can also trace every event to its origins and explore all events moments before or after its occurrence with the surround search feature.
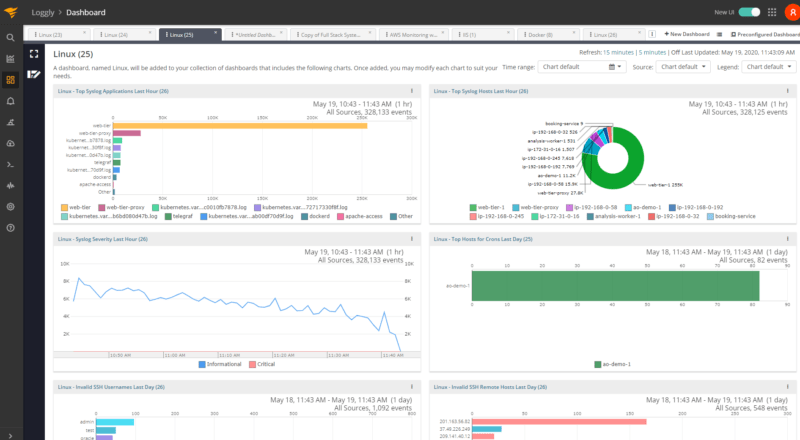
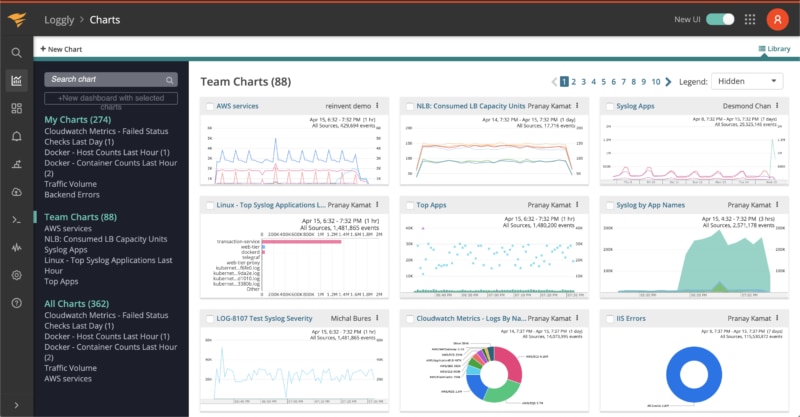
Loggly offers pre-configured dashboards for monitoring logs and metrics from Java, PHP, Python, Node.js, Rails, and more. You can also build custom dashboards to monitor your application or specific sections of your application.
All the charts in a dashboard can be synced with a single click. It is also possible to compare charts over a period using timeshift function. Further, you can drag and resize charts in a dashboard and display it over a large screen in your operations center to prove a bird’s-eye view of your application to your team. The charts and dashboards will help you identify and solve problems easily, collaborate on fixes, and create reports for all stakeholders.