Technical Resources
Educational Resources
APM Integrated Experience
Connect with Us
In modern IT environments, development teams may use different frameworks for developing Java applications, which can produce logs in different formats. Managing all these logs is a big challenge.
IT Teams are overburdened with several tickets and have to fix issues in a short amount of time. However, traditional Java log monitoring tools can get sluggish under higher workloads, slowing down search and log analysis.
As teams have to find efficient ways of searching and analyzing their Java logs, they often rely on a range of open-source tools. However, configuring and optimizing these tools is a complex process.
SolarWinds® Loggly® helps you centralize and monitor Java log files in one place to streamline log management, search, and analytics. The centralized log management is a requisite in modern distributed environments and where teams need remote access to their logs. It also helps IT teams correlate different application and infrastructure logs to troubleshoot issues faster. Loggly has an agentless architecture which makes log aggregation simpler.
You can send Java logs to Loggly using Logback syslog appender. As logs get past the retention period, they are automatically archived on AWS S3 buckets and can be retrieved anytime for compliance or other purposes.

Loggly helps you extract useful information from your logs faster with its interactive search and analytics features. You don’t need knowledge of any proprietary query language to run your searches. Unlike other tools, Loggly always gives quick results for your searches. It can automatically parse a wide range of log types and present a structured summary of these logs with its intuitive dynamic field explorer.
You can inspect all events surrounding a critical event with surround search and can monitor logs in real time using the live log tail feature. Further, you can integrate Loggly with Takipi for in-depth analysis of your Java logs.

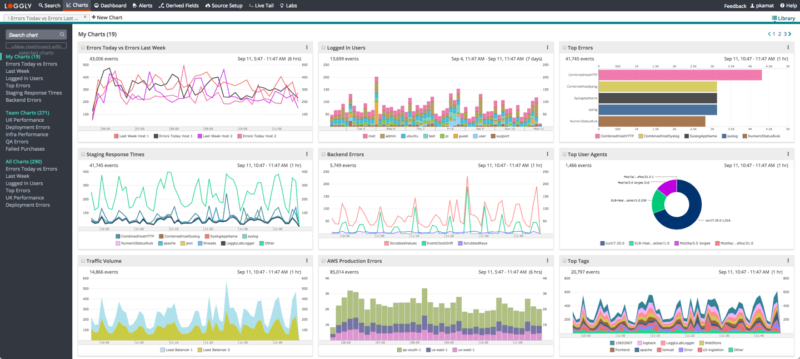
Loggly streamlines monitoring and analysis with a pre-configured dashboard for Java. You can install the dashboard with a single click and get the most crucial performance and usage-related statistics from your Java logs. Further, you can easily sync all the charts in the dashboard in one click and can also customize the dashboard to suit your specific requirements.
With a graphical representation, you can easily explore hidden patterns and anomalies. Moreover, Loggly integrates with GitHub and Jira to support your operational workflows. You can also use notification services like Slack, PagerDuty, HipChat, and more for receiving alerts. All these functionalities help you collaborate and troubleshoot issues faster.