Technical Resources
Educational Resources
APM Integrated Experience
Connect with Us
Organizations prefer centralized log management to correlate different infrastructure and application logs. However, in modern distributed environments, logs can spiral out of control.
Traditional GC log analysis tools can get slow when sifting through large volumes of log data. The degraded performance makes it difficult to find the root cause of issues for troubleshooting.
Limited visualization capabilities can impede detection of memory leaks, premature object promotions, long GC pauses, and other anomalies, and increase the time to resolve issues.
SolarWinds® Loggly® offers an easy approach for centralizing all your logs for full GC log analysis. As a cloud-based log management and analytics service, Loggly is simple to install and manage. Unlike other GC log analyzers, Loggly has an agentless architecture that helps you get started quickly.
The service makes it simple to collect and analyze logs from different Java frameworks and applications. You can send GC logs to Loggly using rsyslog, and with all your logs in one place, you can easily correlate the log data to resolve memory leaks and GC problems. Loggly automatically archives your older logs on AWS S3 buckets for compliance purposes.
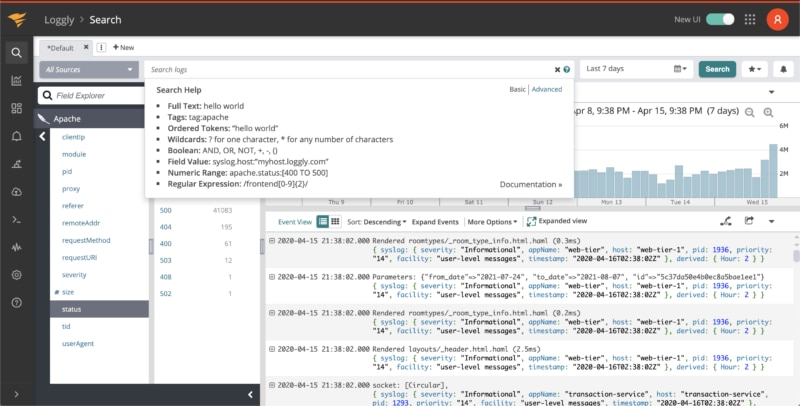
Loggly expedites troubleshooting with its highly interactive search and analysis features. It can browse through a large volume of logs from your distributed stack and help you get to the root cause of problems quickly. It supports Lucene query syntax and automatically recognizes GC logs.
You can search all your GC logs by entering “javagc” in the search box. You can also perform searches using particular fields. The Loggly engine provides near-instant results to all your search queries. Further, the Loggly Dynamic Field Explorer™ allows you to click and browse through the logs without using multiple commands.
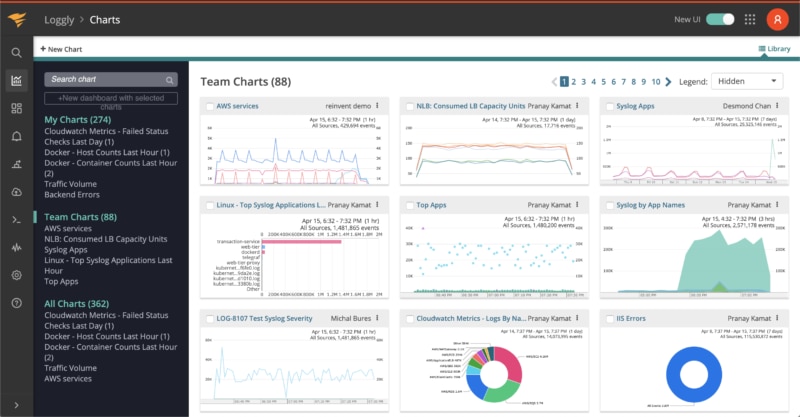
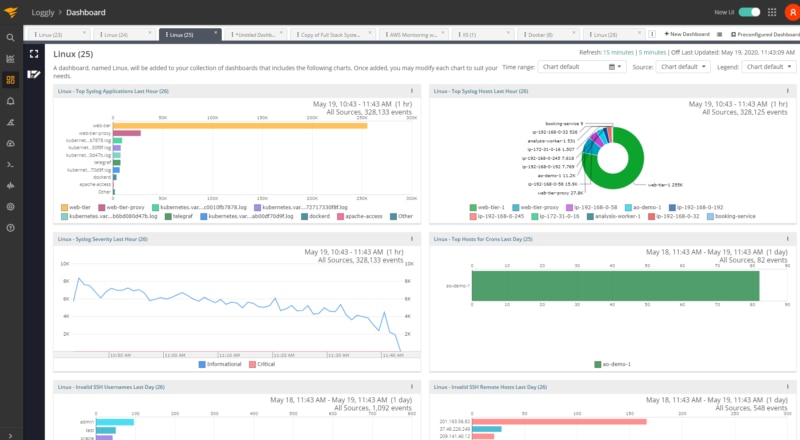
Loggly offers a preconfigured dashboard that can help you visualize GC activity. The dashboard includes charts that provide you with a quick overview of Full vs Minor GC activity, Full and Minor GC times, and heap details. You can customize this dashboard, and drag and resize the charts as needed.
Loggly also allows you to share dashboards with your team members with different access restrictions. With these dashboards, you and your team can stay on top of your environment and detect any anomalies faster. You can also download the dashboard and include it in your reports in PNG format.
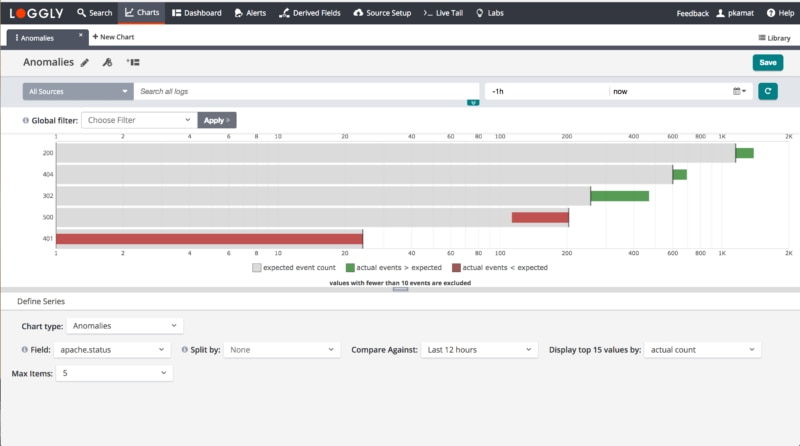
Discovering when critical metrics are changing unexpectedly is essential for catching performance problems before they affect your users. Loggly supports anomaly detection that allows you to see whether field values have increased or decreased in frequency, making it easy to spot when new problems occur or when a performance fix has addressed a pre-existing issue.
The anomaly search interface lets you compare the current time range with a previous one known as a background time range, and shows you where the observed field values in your logs differ from the historical ones. The anomaly detection feature allows you to sort your search results by value significance, difference, as well as actual and expected values. That way, you can always find the fields that you need at the top of the results.
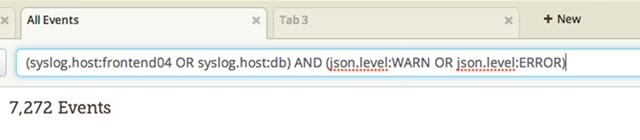
To uncover insights in your logs you need to be able to create expressive queries that locate the right data. Loggly supports a simple query language based on Apache Lucene. Search through all of your GC logs using standard boolean operators such as AND, OR, and NOT. And with the TO operator, you can even search for log messages containing a range of values, which is handy for finding log messages with a response latency above a threshold.
If you need to build more complex queries, Loggly supports proximity matching that finds log data with tokens within a certain distance of each other, as well as fuzzy matching to find a token within a given character edit distance
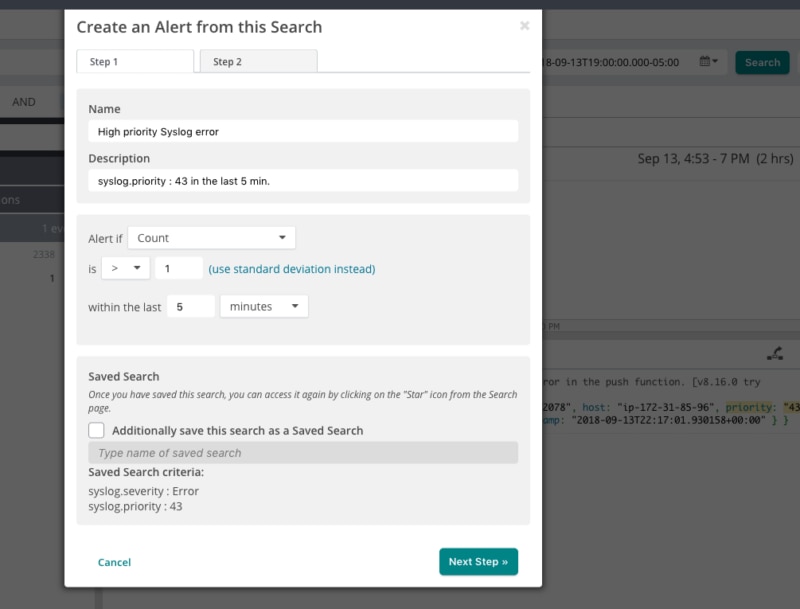
Manually running search queries to monitor the performance of the JVM and your app’s GC behavior wastes precious time and effort. Turn your saved searches into alerts by assigning a schedule and running them at a predetermined time. You can control both how frequently the search executes and the threshold that should cause the alert to trigger. With alerts you can proactively monitor your app and detect problems—such as latency spikes caused by GC pauses—and automatically receive notifications.
Loggly alerts support a number of third-party services, so you can receive alerts using Slack, PagerDuty, and HipChat. Plus, you can send alerts using email and custom HTTP endpoints with GET and POST requests. No matter which tools your team uses, you’ll always know about problems before your users.
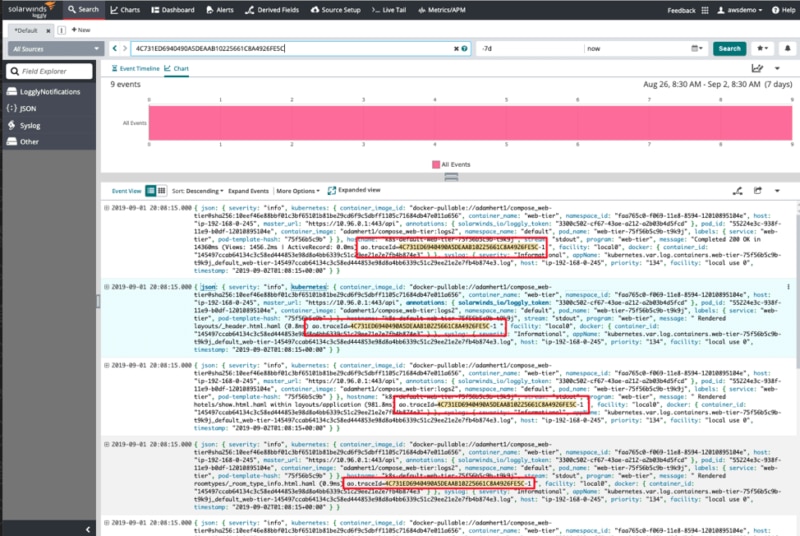
Finding the root cause of exceptions and performance issues in complex Java applications usually involves sifting through log messages and trying to map which messages are related to a single transaction. This is a manual and time-consuming task, often based on assumptions and guesswork.
With the integration of Loggly and SolarWinds AppOptics™, you can automatically insert trace IDs into your logs and easily correlate related messages. And that makes troubleshooting much faster. The integration uses a shared agent across AppOptics and Loggly to automatically instrument your app and propagate trace IDs using HTTP headers. Once you’ve found a trace ID you want to follow, you can use the trace view in AppOptics to jump to Loggly and dig into the details.