Technical Resources
Educational Resources
APM Integrated Experience
Connect with Us
Enterprises today have event data spread across numerous apps, clouds, and endpoints. Traditional data logging software isn't equipped to handle this complexity.
Traditional logging tools don’t aggregate application data or parse the events. Anomaly detection can be time-consuming and difficult.
Traditional tools for logging offer limited features for data visualization. Furthermore, tedious workflows with unimaginative user interfaces can make things more complicated.

SolarWinds® Loggly® is a powerful log aggregation and monitoring solution that makes investigations, reporting, and trouble-shooting effortless. Loggly unifies analysis of text-based logs across a wide range of cloud platforms, web servers, operating systems, databases, microservices, and applications. This effectively ensures that you can perform all troubleshooting, monitoring, and analysis from a single platform—without the need to switch between different applications.
Loggly is also easy to set up, which means you can start solving problems right away.

Traditional logging tools are useful as long as you know what you are looking for; however, in the modern cloud and micro services-based production environment, you have to be ready for the unknown. This becomes even more challenging when you are dealing with microservices running across numerous instances in production.
By integrating and visualizing log data from all such sources, Loggly makes troubleshooting and fault-finding easier. Furthermore, Loggly relies on smart anomaly detection to find unusual patterns hidden in data for raising automated alerts. These intelligent alerts help you mitigate any potential threats or repair application errors quickly.

Modern enterprises depend on a large ecosystem of tools and integrations that add agility to the DevOps pipeline. Loggly offers easy integration with tools like Slack, Jira, GitHub, and more to help DevOps teams increase their productivity.
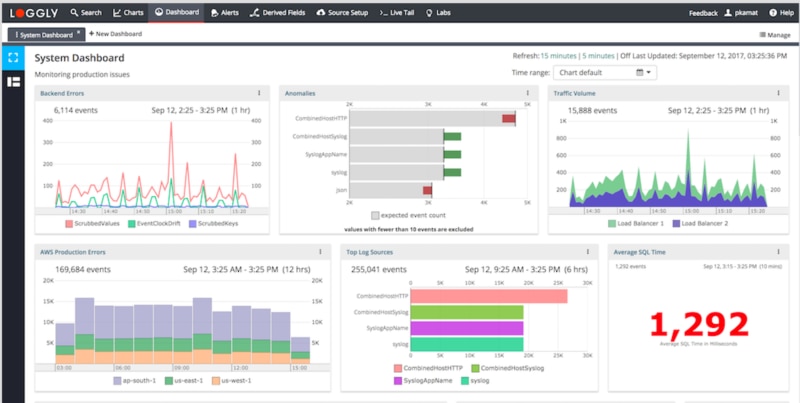
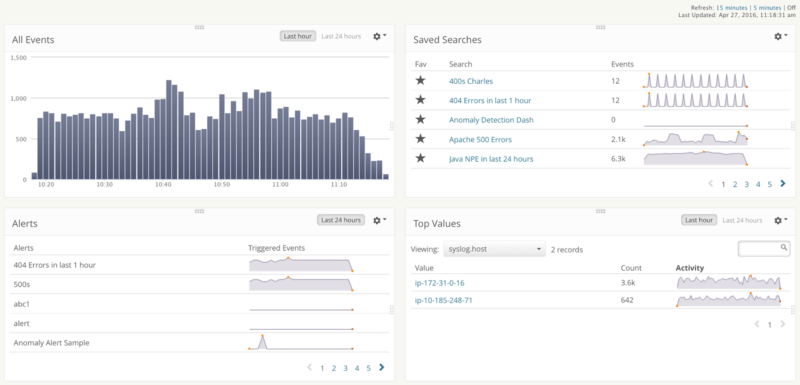
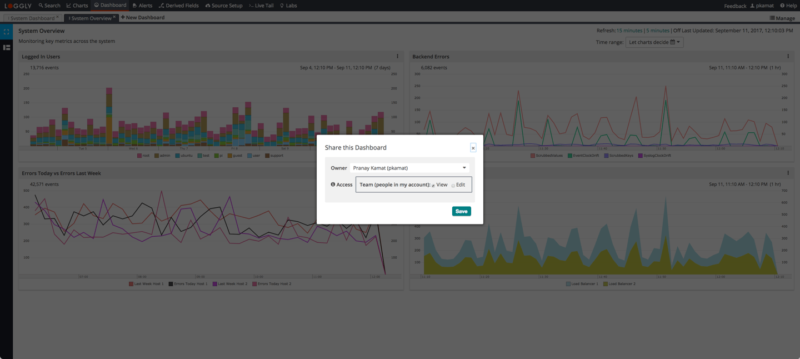
Furthermore, Loggly simplifies troubleshooting with custom as well as ready-to-use interactive dashboards that convert arcane logs into highly visual charts and reports. The graphical representation of KPIs, network, and application metrics gives you a bird’s-eye view of your entire setup. You can also share these dashboards with other team members and give them access to view or edit the reports.