Technical Resources
Educational Resources
APM Integrated Experience
Connect with Us
Today, applications are hosted on several servers. DevOps teams can struggle to track and manage logs in this distributed setup if they don’t have access to proper tools for centralized logging and analysis.
While putting all your logs from a Python logger in one place can be handy, your teams may struggle to make sense of this data. Traditional logging tools put data in silos and have limited search features, which makes troubleshooting a big challenge.
It is not simple to monitor huge volumes of log data and correlate different metrics without using data visualization. Not all Python data loggers have advanced visual features, which makes it difficult to analyze trends and key metrics over a period.

SolarWinds® Loggly® is built for modern distributed environments where monitoring application data is more challenging than ever before. Thankfully, with Loggly, you can centrally manage all your Python logs in a reliable manner. Unlike other tools, getting started with Loggly is a breeze with quick configuration and some powerful single-line scripts.
The agentless architecture ensures that you don’t have to install any extra piece of software for transmitting logs to Loggly. Python logs can be sent to Loggly over syslog or over HTTP using a RESTful API. For a long-term archival, Loggly can use Amazon S3 buckets. This means that none of your logs are lost even as the log volume keeps on multiplying.

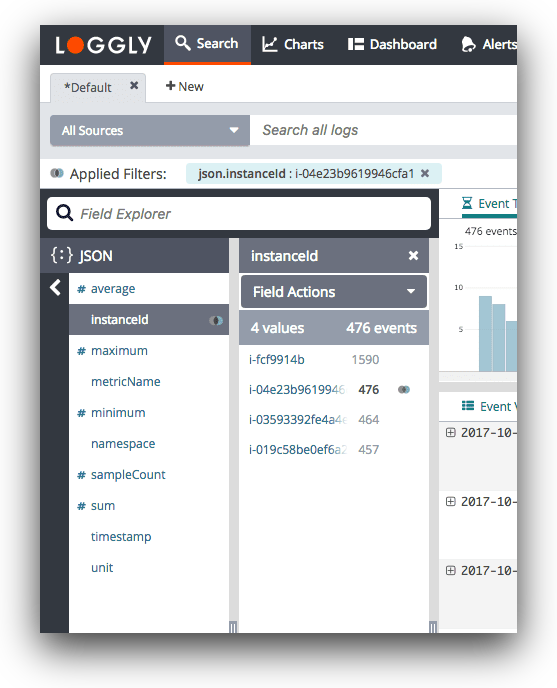
Loggly is unlike any other Python logger; it automatically parses your logs as soon as it receives them. This helps it structure your log data for near-instant results and allows you to click and browse log data with a Dynamic Field Explorer.
With prepopulated information present in the Explorer, you don’t have to start every search from a blank screen. Moreover, Loggly links your exception logs to source code which can be accessed with a single click. In addition to the GitHub integration for linking source code, it also integrates with Jira, which allows your team to create tickets within Loggly. All these features significantly improve the troubleshooting experience.

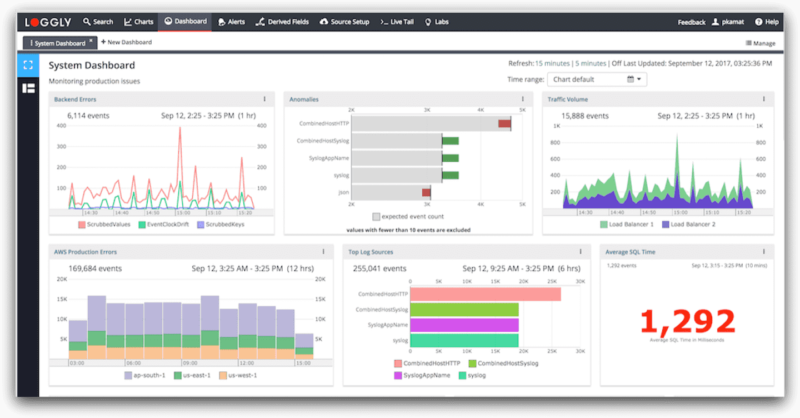
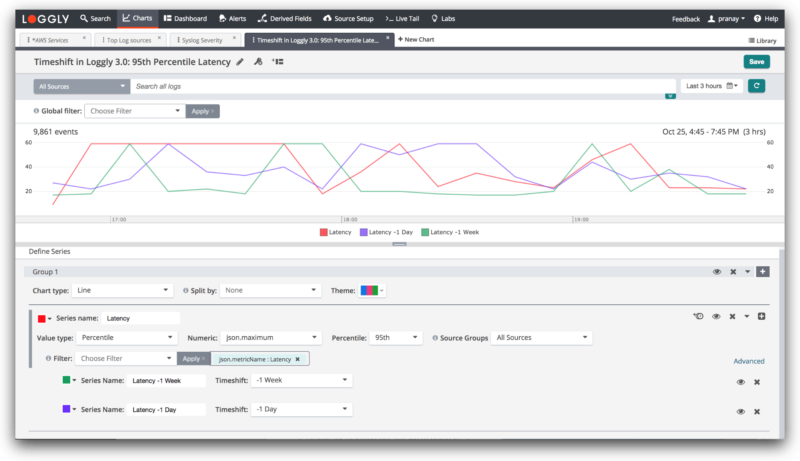
You can define reusable charts to create shareable dashboards that unify multiple metrics and performance indicators for a birds-eye view of your application and infrastructure. These charts can display simple log event counts as well as averages, percentiles, and more complex metrics. You can click any spike in these charts to find associated logs for deeper troubleshooting.
The anomalies chart helps you identify any troublesome pattern which otherwise would have skipped detection from your threshold-based alerts. To expedite troubleshooting, the charts can be synced to a single time frame with a single click. The charts and dashboards keep your team on the same page and improve collaboration for troubleshooting tasks.